
|
|
The TWPI in action |
The IPI has launched a complete system of hardware and software for measuring and analysing climate data. It comprises a data logger with a memory chip containing the look-up table of lifetimes explained on the previous page. The data logger shows temperature and relative humidity together with the Preservation Index (PI) and the Time Weighted Preservation Index (TWPI), both calculated at every measuring moment. There is also a matching computer program, which runs only on Microsoft's Windows operating system. I have no experience of running this program, since I don't have that operating system. I don't have any experience of the specialised data logger either. However, one can do the same data reduction without any part of this specialised kit.
Let us look at an example from a museum exhibition room.
The Prince's Palace in the centre of Copenhagen is now the National Museum of Denmark. The room shown in figure 1 is heated gently in winter and inadequately humidified. Its climate is typical of a historic house museum in the temperate zone. Both temperature and relative humidity have an annual cycle, both moving up and down together, giving in combination a considerably higher degradation rate in summer, as predicted by the Preservation Index.
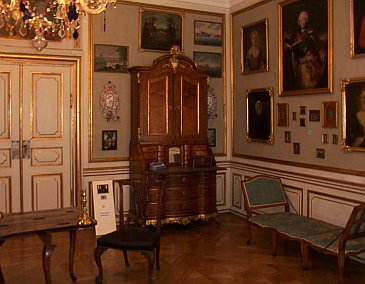
Figure 1. A room in the Princes Palace, Copenhagen, built in 1744.
The next figure shows the climate over more than a year. The conventional temperature and relative humidity lines are supplemented by two pairs of traces: the reaction rate (at the bottom of the graph) and the lifetime (PI, at the top of the graph), both as predicted by the Image Permanence Institute's Preservation Index and as predicted by a mass-action/Arrhenius fit (TPI) to the PI table of values. The two calculation methods give similar results, differing only enough to give a pleasing flame effect to the lifetime prediction.
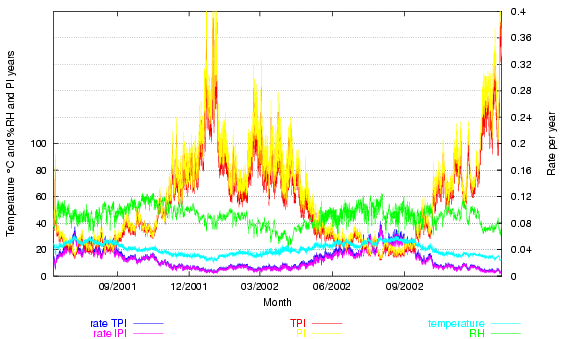
Figure 2. The room climate, the Preservation Index expressed as a lifetime (the highest two traces) and as a rate of degradation (at the bottom of the graph).
The Time Weighted Preservation Index (TWPI) is not plotted. The value of the TWPI at any particular hour is not interesting, unless the room is fully air conditioned to a constant climate, in which case the TWPI will be the same as the PI, which will be constant, so there is no point in further measurement, except for quality control. The TWPI is misleading at any point during less than a year of measurement in a room whose climate is influenced by the outside climate and is misleading for a period over a year because if two summers are included but only one winter, as in figure 2, the TWPI will be lower ( = a higher rate of degradation) than after exactly one year, and higher than after exactly two years. The TWPI is only meaningful when it is calculated on the anniversary of starting the measurement. The PI is only an intermediate step towards calculating the TWPI. It may have a certain didactic value, to show how damaging high temperature and RH are predicted to be, but this effect, once seen, does not need to be repeated in every hourly climate display.
Quoting PI and TWPI in years gives a spurious precision to a useful concept. Regarding the PI as years to a significantly degraded state is maybe valid for triacetate based film, but not for anything else. The room shown in figure 1 has a TWPI of about 40 years, which will suprise and dismay the curator of the antique furnishings, some original to the building. The IPI forces the science to support more than it can bear. One cannot take a particular reaction, whose kinetics are treated empirically to give a life expectancy, and then suggest that it can be applied to any organic material, invoking the Arrhenius law, which was not actually used, to support the generality of the concept. The IPI can protest that it presents the PI as an indication, to be interpreted by the conservator, but that is not what they claim on the climate notebook website, and the explicit use of years of life gives an impression of precision that is misleading.
I suggest that we return to the simpler formulation of Sebera's isoperm: take an arbitrary but typical activation energy, say 100kJ/mol and assume proportionality between reaction rate and RH. We can choose the constant to give a rate of reaction of unity at 20°C and 50%RH. Then we can calculate the average rate from a real data set to get a figure of merit for the climate.
Here is the same climate data for the Prince's palace, with this relative rate shown (at the bottom of the graph, read on the right hand scale). The average rate is 1.15. The excursions of temperature over 20° more than compensate for the periods of low temperature and low relative humidity. Note, however, that two summers are included in the calculation. If one measures for exactly one year, the relative rate goes down to 1.03.
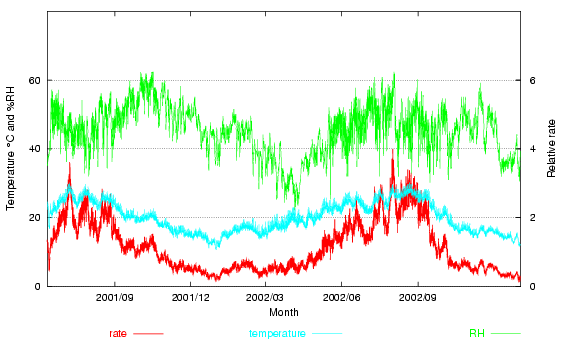
Figure 3. The room climate, with the degradation rate derived from a mass-action/Arrhenius calculation arbitrarily set to equal unity at 20°C and 50% RH.
This treatment is exactly the same as the Sebera method and probably the same as the ASHRAE method, except that I have used the IPI extension of applying a general model to an actual data set from a real location. I should interject here that the priority for this sort of calculation probably belongs to Mark McCormick-Goodhart, who invented the 'time-out-of-storage' concept to demonstrate that the high decay rate during the short period in the warm is vastly more damaging than the very slow decay rate in the long periods in the cold store, so there is no reason to go to extreme cold storage for specimens that are likely to move in and out of storage.
I criticise the IPI for focussing on a single reaction as sufficiently representative of the degradation processes that afflict artifacts. An ester hydrolysis is not a bad choice, but how representative is it? If we take relative humidity alone, consider the case I observed in a Geological Museum: the case was a small bell jar with a cork closing the lower end. A metal claw stuck up from the base into the clear liquid which almost filled the bell jar. Beside this exhibit was the title written on a card: "Rock Salt".
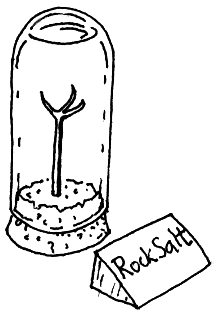
Rock salt will absorb water from the atmosphere and dissolve in it if the relative humidity exceeds 76%. The process is fairly rapid, probably limited in this case by diffusion of water vapour through the cork. The important point for this discussion is that if the relative humidity is 70%, the rock salt will not dissolve in a trillion years. There is no proportionality between reaction rate and RH. It is stop or go. One might remark that this is a pretty esoteric example, rock salt exhibits being not so central to our civilisation as the accumulated film archive of the last century and a half. But the deliquescence of water soluble salts on the surfaces of objects is a potent and common facilitator of corrosion. The thin liquid layer, often invisible, provides an ionising solvent that allows reactions that otherwise would not occur.
Rising temperature also has effects beyond the Arrhenius process. Quite rapid changes of state occur over a narrow temperature range, notably the glass transition of plastics, which quite suddenly become softer, more available for chemical change and open to diffusion of plasticisers.
It is probably sensible to confine the use of the IPI TWPI to collections whose main decay mechanisms are known to be hydrolysis. But as our information accumulates it is already clear that even within this class of reaction the variation in activation energy is an important indicator of how seriously we should take deviations from the ideal climate. The single example used by the IPI obscures the greater temperature sensitivity of particular reactions important to conservators, such as the decomposition of cellulose nitrate.
The IPI's derivation and presentation of its Preservation Index is muddled. The rate of the example reaction is interpreted empirically, though the label 'Arrhenius' is used to support its generality. The temperature dependence of the effect of relative humidity has no theoretical justification. Data for another film base, cellulose nitrate, shows a much greater activation energy, which gives a greatly increased temperature sensitivity of the reaction rate, implying that one should use much more stringent climate control, yet the cellulose triacetate results are burned into a data logger memory and the data logger calculation of PI is shown on its display with equal weight to the temperature and relative humidity. The Preservation Index is presented as a lifetime, for dramatic impact, but the calculation is thereby complicated, leading to an obscure title for the average PI: the 'Time Weighted Preservation Index' (TWPI). The instantaneous value of the PI is of transient interest and the TWPI has no useful meaning until exactly a year of data have been collected, yet these two numbers are displayed continuously and are used as a marketing feature to promote a specialised data logger. The calculation, even in its complicated lifetime format, is a trivial exercise for a spreadsheet or a script, yet one is pressed to buy the 'Climate Notebook' computer program, which only runs on one operating system and is not open source, raising doubt about its durability. My conclusion is that the IPI is striving to market a simple concept, with some demonstration value, as a complicated and expensive management tool.
On the next page I present a re-evaluation of Don Sebera's concept of the isoPerm and introduce a variant: the isoBurn!
If one wants to apply the PI and TWPI to local climate data, one can do it more cheaply than by buying a data logger, or the IPI's calculation program.
I will describe the orthodox derivation from the mass action and Arrhenius laws. The IPI version can be substituted from the formula given on the first page (remember that the IPI formula has to be divided into unity to give the rate). The results will be similar, regardless of method.
Load your climate data into a spreadsheet program so the temperature in celsius is in column 't' and the RH% is in column 'rh', you then calculate a third column, 'rate, per year', thus:
rate = rh × 5.9 × 10¹² × exp(-90300/(8.314 × (t + 273)))
Check: rh=70, t=30: rate = 0.112 per year, lifetime = 8.94 years.
If you want to make a Sebera/ASHRAE type of relative rate calculation use this formula:
rate = rh × 1.34 × 10¹⁶ × exp(-100000/(8.314 × (t + 273)))
If you want the rate in PI lifetime format, just make another column, years =1/rate. You won't use this in the later calculation, so it is not really necessary.
At the bottom of the spreadsheet you sum all the values in column 'rate' and divide by the number of rows. This is the TWPI as an average rate. To turn it into years of life, calculate 1/(average rate).
That is all there is to it. The calculation depends on all the measurements being at equal intervals, but it doesn't matter what the interval is. One hour is recommended. You should also record the total period of the data set, one year is recommended, so you can merge this TWPI with later measurements. The exact formulation of the expressions depends on the spreadsheet you are using.
This sort of simple but repetitive calculation is really best done with a dedicated script, because it is tedious and unnecessary to import climate data into a spreadsheet.
The do-it-yourself climate-data to TWPI calculator:
Download the file twpi.py.txt
Rename it to twpi.py
The script is in the Python language. This is a general purpose interpreted language, widely used for scientific calculations (it can also be used as a convenient interactive calculator). Python runs on all operating systems but it has to be installed by the user on MSWindows (see: www.python.org).
Once you have the interpreter running, bring up a text console and type:
prompt>python twpi.py -h
This will show the instructions for use.
You may need to type the whole path to the twpi.py file, if Python says it cannot find it.
An advantage of using a script is that you can adjust the equation very easily. It is listed in a single instruction towards the top of the script.
IPI documentation:
The IPI experiments and calculations that support the Climate Notebook and associated hardware seem not to have been published in a peer reviewed journal. The reference cited on the web site is:
James M. Reilly, Douglas W. Nishimura, Edward Zinn, 'New Tools for Preservation, assessing long-term environmental effects on library and archives collections' The Commission on Preservation and Access, Washington DC, 1995, ISBN: 1-887334-46-7. (Available also from the IPI website, for a small fee).
Here one reads, in the appendix on page 24: "...the Arrhenius approach is the only predictive type of accelerated aging; it is the only way to estimate future behavior. ... Arrhenius testing rests on a very solid foundation of classical chemical kinetics."
However, according to my correspondence with Douglas Nishimura, the PI does not rest on an Arrhenius analysis, since the look up table of lifetimes for various combinations of temperature and RH was derived empirically to fit the experimental data. After this, coefficients of an exponential equation were fitted to these lifetime values. In this fit, RH is given a temperature dependent influence, necessarily changing the value of the activation energy.
IPI's claim for the broad validity of the PI:
I quote from the website of the Climate Notebook:
"
'Time out of storage': This is Mark McCormick-Goodhart's idea for averaging degradation of materials that live mostly in suspended animation in cold stores but are taken out for exhibition at room temperature. It was developed in 1992:
http://www.si.edu/scmre/about/93psp.htm
The climate data from the Prince's Palace (room 134) were collected by Morten Ryhl-Svendsen and partly financed by the EU 5th Framework MIMIC project.
Tim Padfield, September 2004

This work is licensed under a Creative Commons Attribution-Noncommercial-No Derivative Works 3.0 License.