Canvas painting, relative humidity buffering, temperature.
Introduction
Paintings set against uninsulated outer walls are exposed to varying temperature gradients. Absorbent and insulating materials within the space enclosed behind the painting affect the moisture content of the painting support in quite a complicated way. This phenomenon is explored through a series of experiments with various arrangements of back protection.
The emphasis is on understanding the micro-environment, using materials and environmental variations which simplify the interpretation. Therefore the materials used in the experiments are not necessarily used by conservators, but rather represent the simplest possible way of understanding the physical processes. The practical implementation of the physical principles is discussed at the end of the article.
Temperature variation in spaces with a uniform water vapour concentration, which is the normal situation, is a potent cause of mould growth and humidity induced damage. This is because the surface relative humidity (RH) at a relatively cold surface can rise very high in spaces which contain a moisture reactive material in equilibrium with a moderate RH but at a higher temperature.
The literature, and the advice, on humidity stabilisation of works of art concentrates on the use of hygroscopic materials to slow down the exchange of moisture between an artefact and an ambient atmosphere of unsuitable RH, with the implicit assumption that the temperature will remain uniform over all the participating materials. We have found two articles which quantify the effect on the RH of a temperature gradient across an enclosed picture. Ligterink and Di Pietro [1] explained the protective effect of stretcher beams close beind the canvas as a result of a disturbance of the temperature gradient influencing the RH without significant moisture exchange with the stretcher. Padfield et al. [2] measured changes of temperature and RH within glazed prints set against outer walls of uninsulated houses.
In this article we fill a gap in the conservation literature by exploring the climate within the enclosure behind a painting where moisture leakage to the surroundings is slow, so changes to the RH at the back of the canvas, and consequent changes to its moisture content, are due to temperature change alone. The experiments were made in a strictly controlled environment, to approximate reality, but with imposed simplicity to reveal subtle processes usually masked by the variation of the weather.
The experimental arrangement
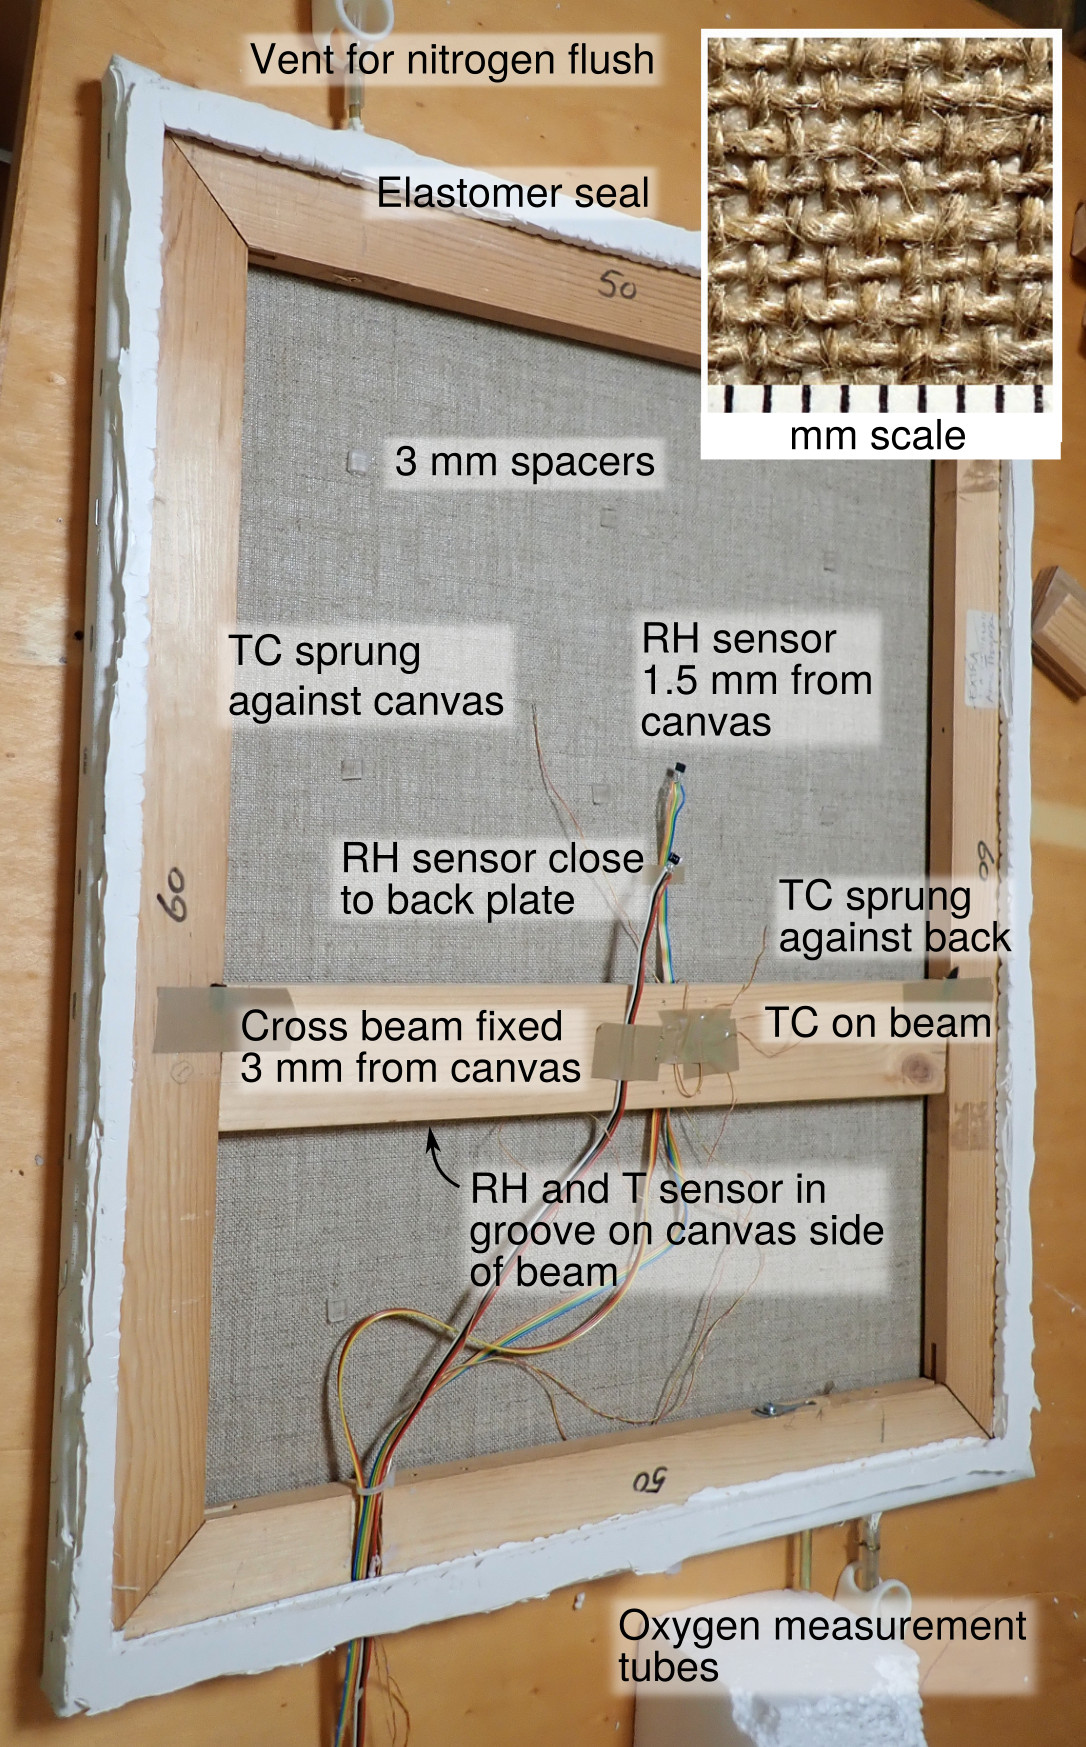
Figure 1. A back view of the experimental canvas stretched over a wooden frame. The fine thermocouples (TC) which spring against the painting canvas and the back plate are scarcely visible. The RH sensors have built-in temperature measurement. There is a third RH sensor mounted in a shallow groove in the cross beam, facing the canvas. The painting dimensions are 600 × 500 mm, the total thickness of the assembly, including an aluminium back plate, is 31 mm. The white material is a flexible polymer sealant.
The canvas was stretched over a conventional softwood frame. Staples were used to hold the canvas to the frame. A coat of white acrylic paint was applied to the outside surface. Its uniformity of colour minimised temperature variation in the plane of the canvas. An airtight seat for the back plate was made from polyurethane elastomer.
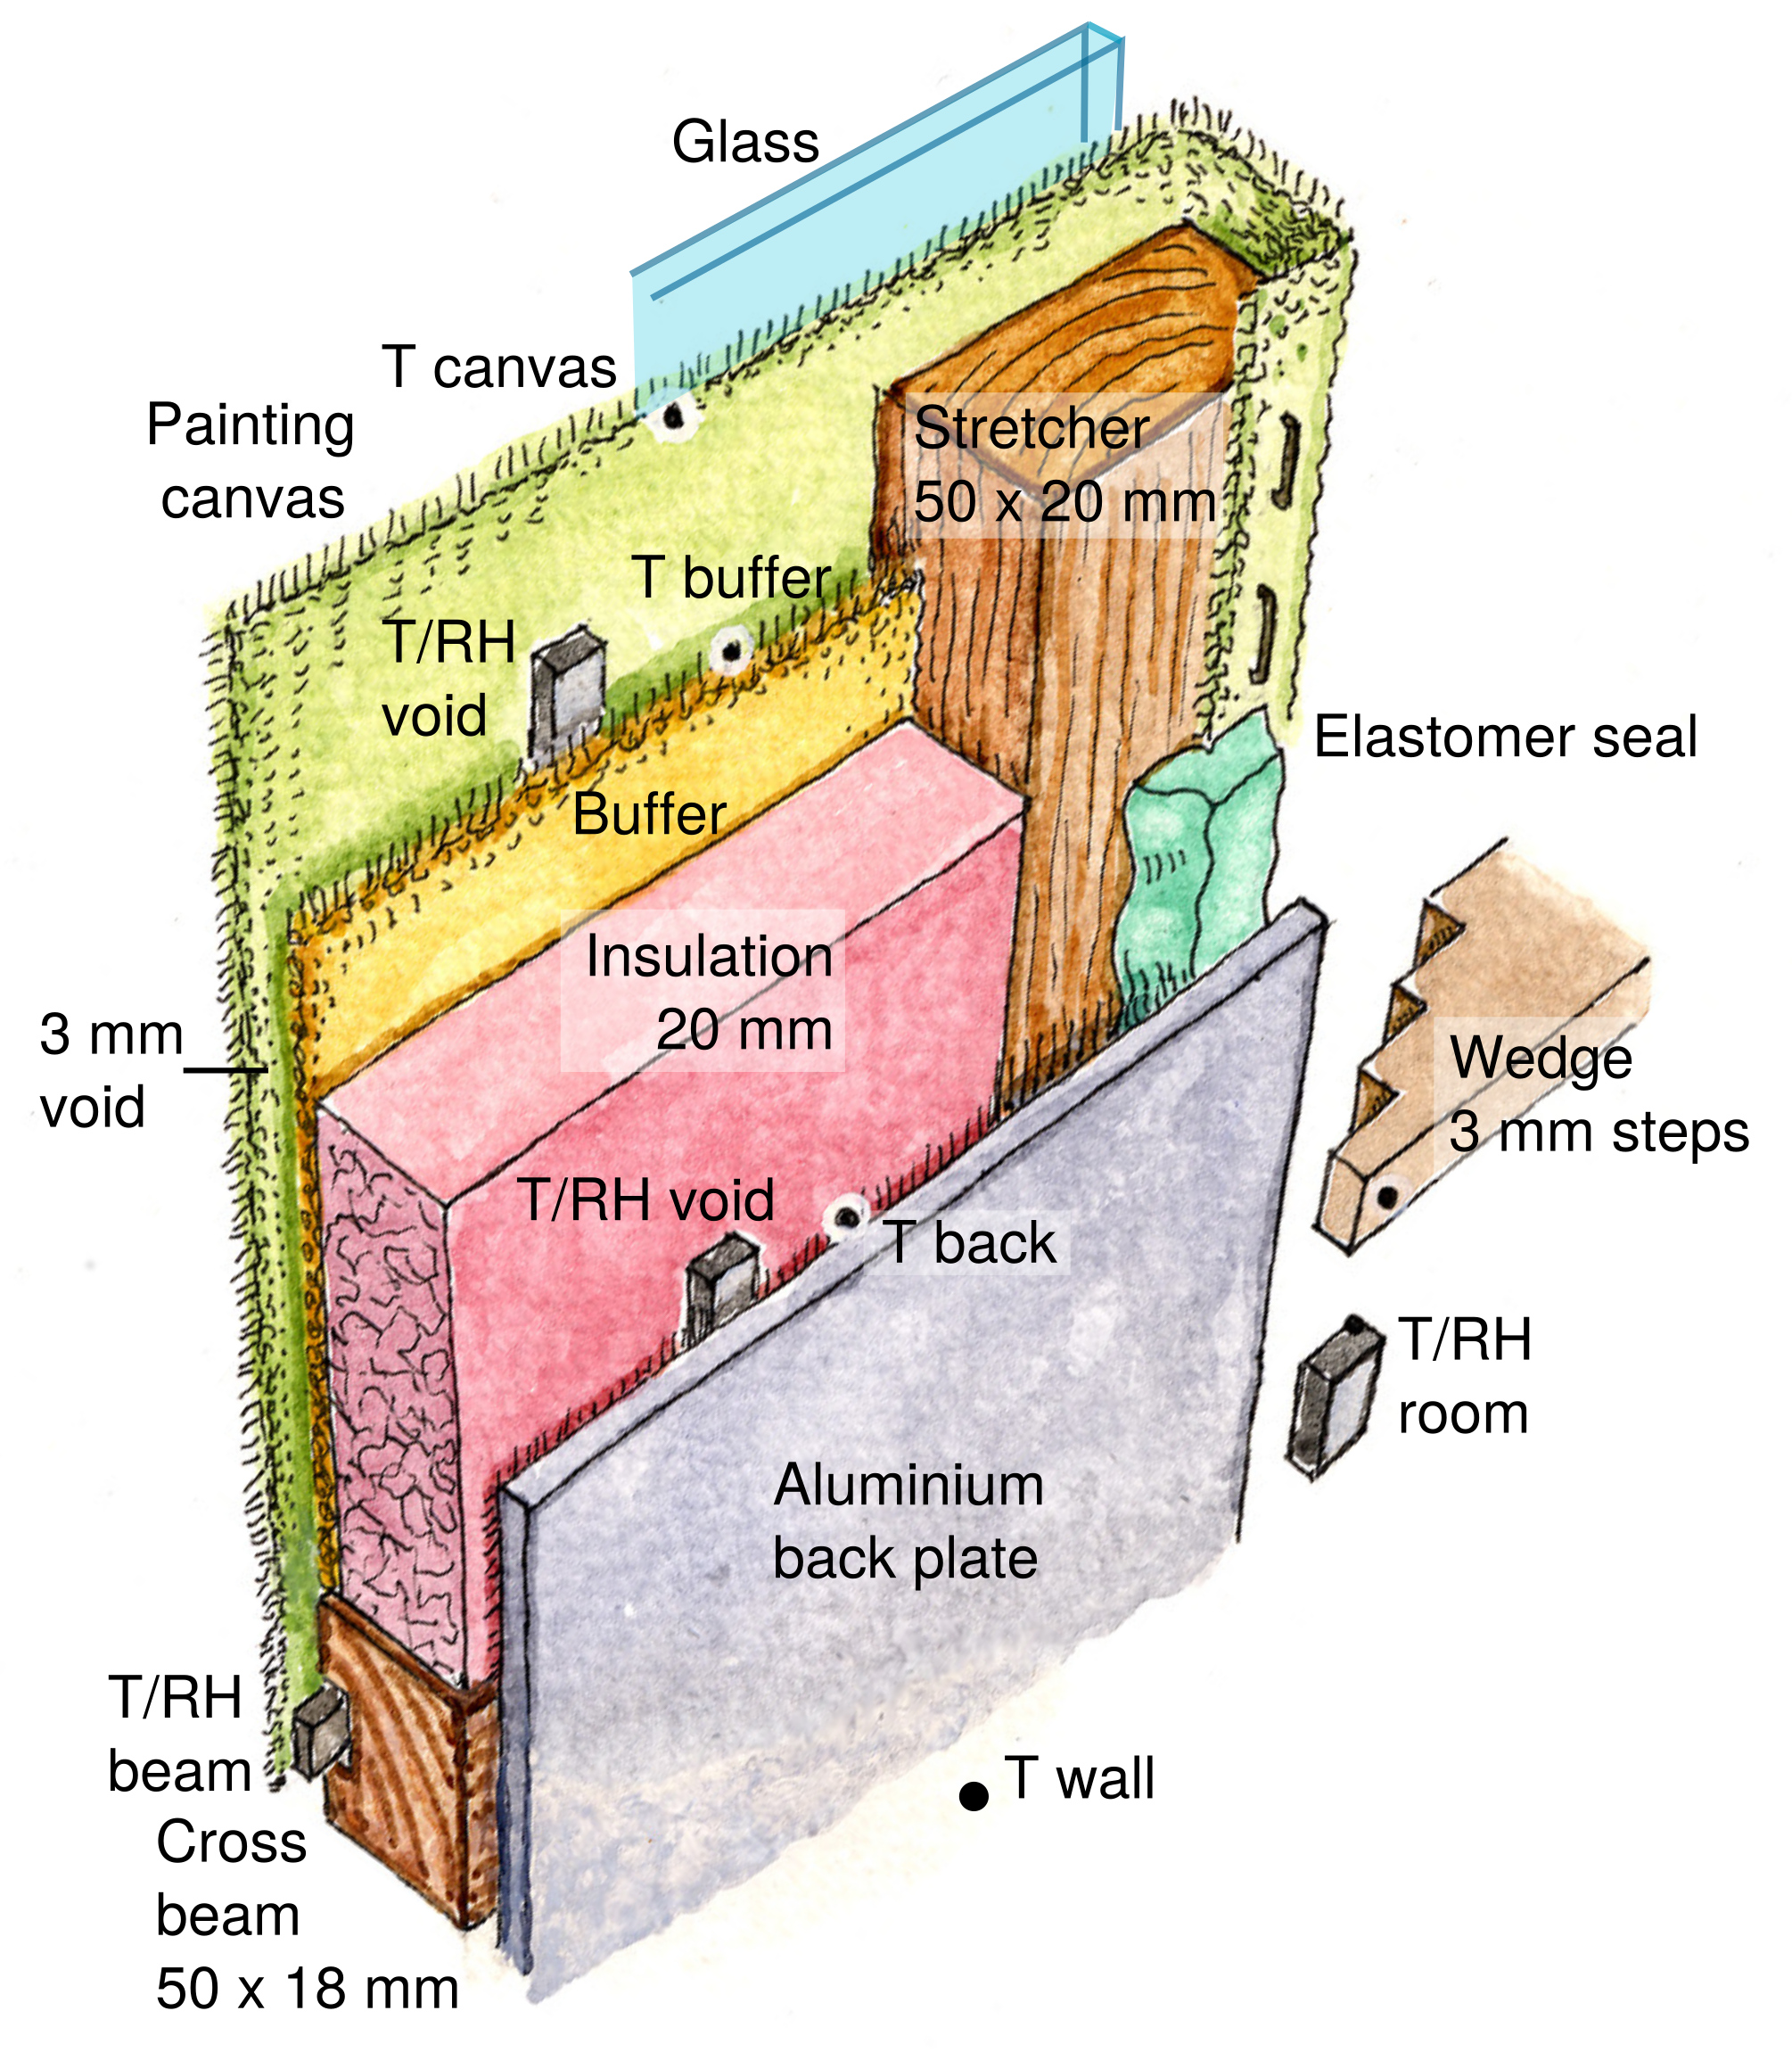
Figure 2. Positions of all the components and sensors set within and around the painting, viewed from the wall side. The stepped wedge, one of four, is used to hold the assembly at a specified distance from the wall.
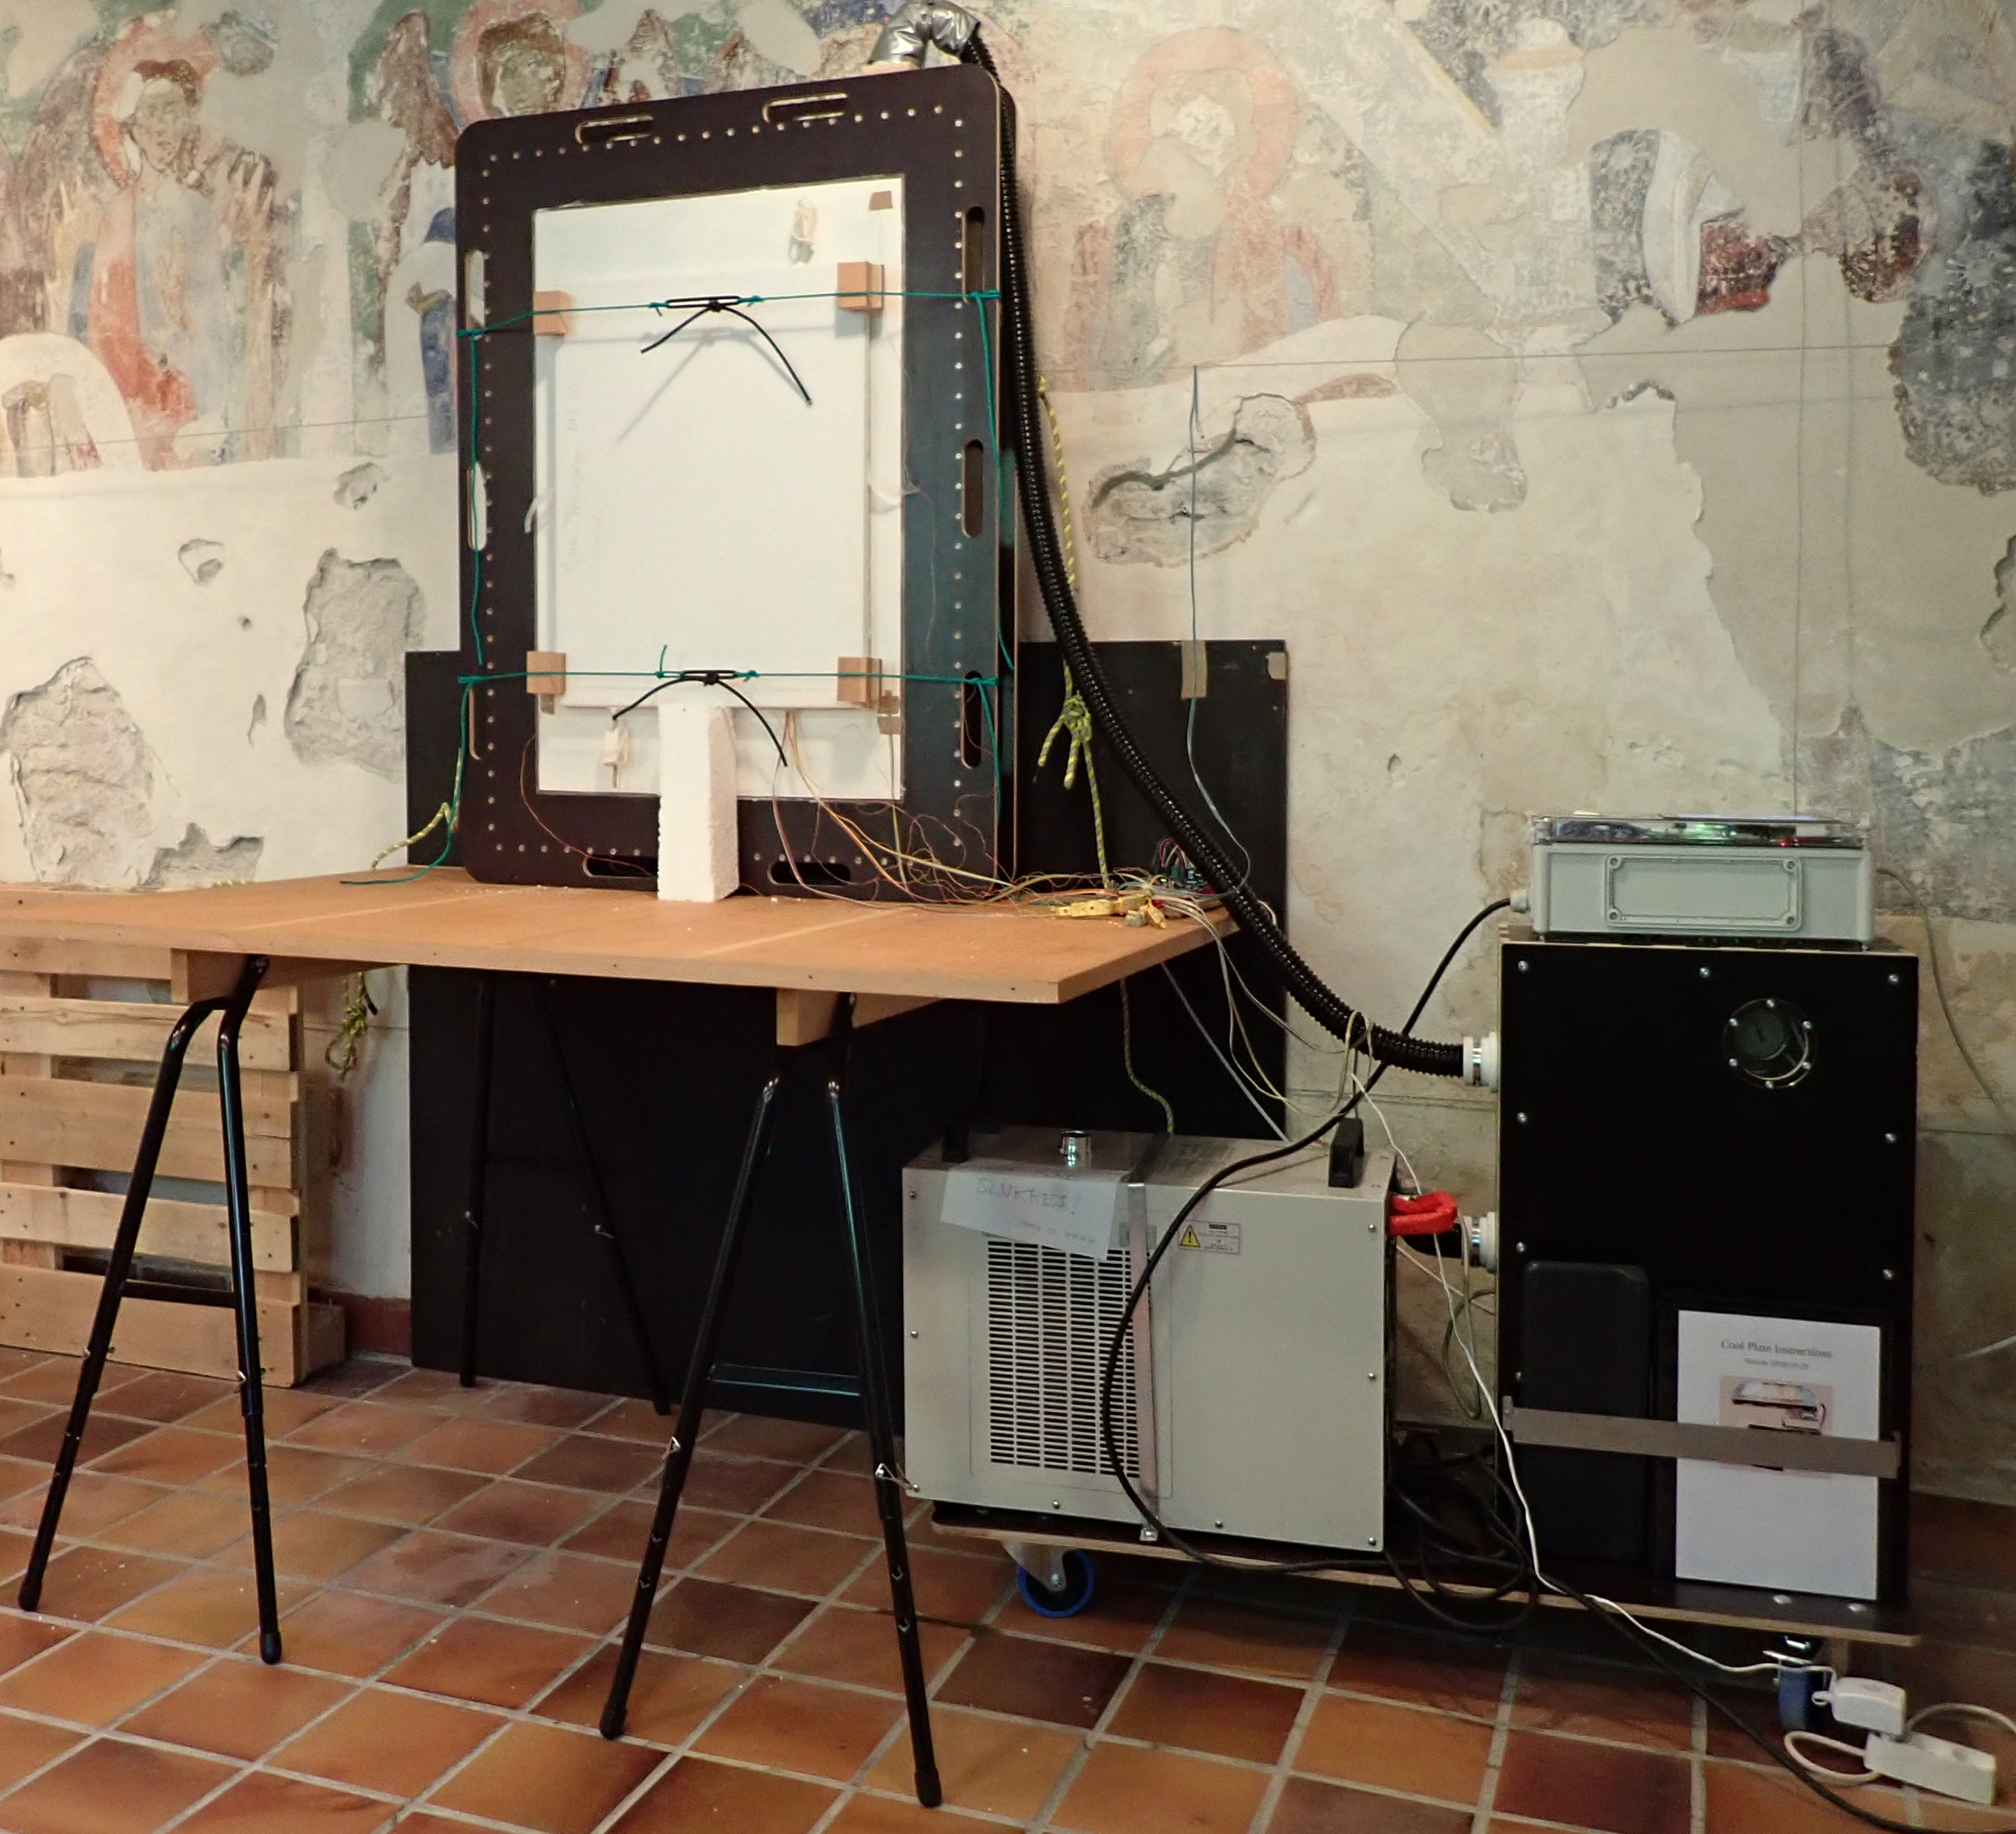
Figure 3. The experimental painting mounted vertically against a “wall” of painted aluminium which is enclosed flush with a plywood frame.
The painting was held against a vertical painted aluminium plate whose temperature could be varied between 12 °C and 40 °C. On the right in figure 3 is the apparatus for recirculating tempered water through a labyrinth of copper piping behind the plate. The data logger is near the bottom right corner of the plate.
The painting was exposed to a sinusoidally varying temperature of the “wall” at its back, with a nearly constant room temperature at its front. Several cycles were measured for each frame construction, some of a four hour period, to detect rapid effects, some of 24 hours to imitate a real situation. Two typical cycles were extracted for graphical display. In some experiments the painting was set to face the aluminium plate while the back plate was fanned with room air, to simulate a varying room temperature against a constant wall temperature.
Measurement of RH at a surface
The relative humidity is the quantity given the most significance in this article. It is the fundamental expression for the potential for water vapour to enter into chemical reactions, cause dimensional change and facilitate biological processes. It is identical to the chemists’ concept of water activity, which is defined as the ratio of the actual partial pressure of water vapour in space to the partial vapour pressure over a pure water surface at the same temperature. From this value one can derive quantitatively the change of mechanical properties which cause deterioration of paint layers on canvas, and the risk of fungal growth on the canvas and other parts of the painting assembly.
Within the space between the painting and the back plate, the concentration of water molecules by weight, expressed as a ratio to the weight of dry air, is the quantity which tends towards a uniform value over the entire space, even in a temperature gradient. This is called the mixing ratio (MR) and is displayed on the lower portion of the graphs.
To interpret the processes at work one has to switch back and forth between MR and RH. The first to describe the migration of water molecules in space, the second to describe migration of water molecules through the material to air interface, which is the buffering process.
It is difficult to be sure of the RH at a surface, particularly if that surface is moisture reactive. Even miniature RH sensors are bulky, 5 × 4 × 2 mm, and obstruct the movement of heat and moisture at the point where they measure.
In these experiments we partially compensated for this practical difficulty by measuring both temperature and relative humidity at a point about 1.5 mm away from the surface, while also measuring the surface temperature nearby with a thin thermocouple, which hardly interfered with the flux of moisture and heat at the surface.
We then estimated the expected RH at the surface by dividing the mixing ratio of the air measured at the RH sensor by the mixing ratio of vapour-saturated air at the surface temperature.
This calculation assumes that there is no significant vapour flux through the surface into the boundary layer. In the experiments described below, this was always true for the aluminium surface of the backing plate. At the canvas surface our RH extrapolation would only be approximate if there were significant moisture exchange between air and canvas.
The magnitude of the difference between the surface RH and the RH at a millimetre or two from the surface is significant in interpreting the experimental results. In the graphs, the calculated surface value and the measured value at the RH sensor are linked by shading.
Experimental results
The environment of the unprotected painting
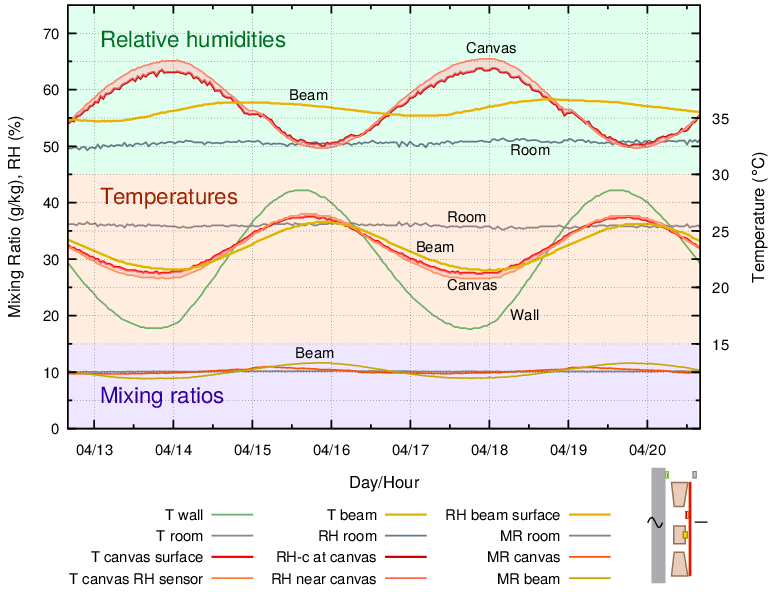
Figure 4. A 4 hour cycle of wall temperature, with an average value below ambient. The painting, without back protection, was mounted with a 10 mm gap between the frame and the wall. The difference between the RH measured at the sensor 1.5 mm from the back of the canvas and the RH calculated at the nearby surface temperature is shown by a tinted band. The calculated value is named RH-c in the key. The sensor temperature and the canvas surface temperature are also linked by a tinted band.
All the graphs in this article have the same pattern, with RH curves clustered at the top, temperatures in the middle (with scale on the right side) and mixing ratios in a band at the bottom of the graph. A thumbnail of the structure is shown at the bottom right. Two RH curves are given, the measured value close to the surface of the canvas and the value calculated from the surface temperature of the canvas. The two curves are linked by a coloured fill, which is pink for the canvas and, in all the other graphs, blue for the RH close to the back plate.
This first experimental graph imitates the normal situation of a painting with an unprotected back and ample circulation of room air behind it. In an art gallery this is usually because the top of the painting is tilted away from the wall, but in our experiment we made a uniform 10 mm gap between frame and wall.
The canvas temperature was approximately half way between ambient and the wall temperature. The vapour concentration at the canvas surface was the same as that in the room, as shown by the nearly identical and flat mixing ratio curves for the room and for the canvas. The RH varies strongly in opposite phase to the canvas temperature.
The RH between the canvas and the wooden cross beam was much more stable. The mixing ratio at this sensor deviated from the room value. This indicated vapour exchange with the wood, and with the adjacent canvas, in this poorly ventilated space.
Adding an impermeable back plate
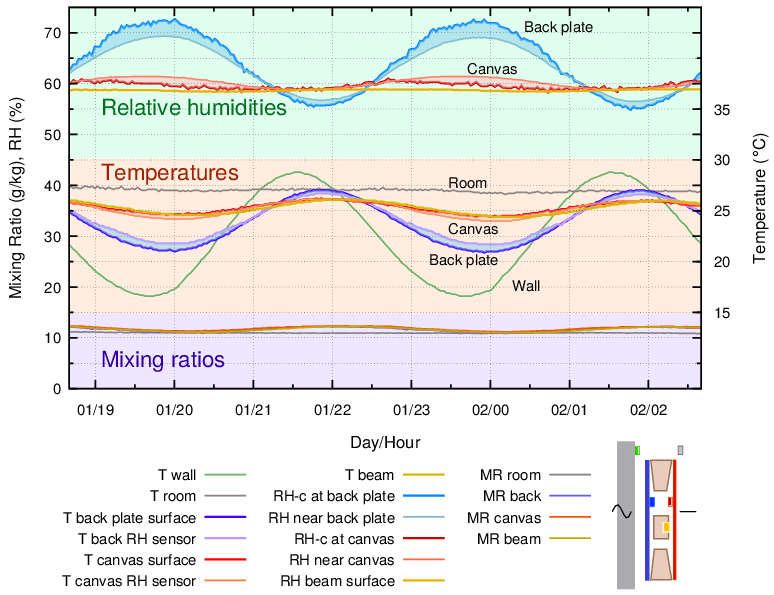
Figure 5. The painting frame was backed by an aluminium plate and held 10 mm from the wall. There are added curves for the temperature and for the RH close to the back plate.
An impermeable, moisture inert plate of aluminium was fastened to the back of the frame, but still separated from the wall by 10 mm. This gave a completely different microclimate within the sealed enclosure. There was a nearly constant RH behind the canvas and the temperature cycle was reduced. The RH stability comes from humidity buffering by the painting’s canvas, as revealed by the varying mixing ratio, indicating repeating evaporation and absorption of vapour into the confined space. The RH close to the cross beam was still very stable. However, the RH at the back plate surface varied strongly over the temperature cycle.
Humidity variation through a temperature gradient
The varying RH at the moisture-inert metal back plate can be explained by reference to two well established diagrams, the psychrometric chart and the sorption isotherms of cellulose [3].
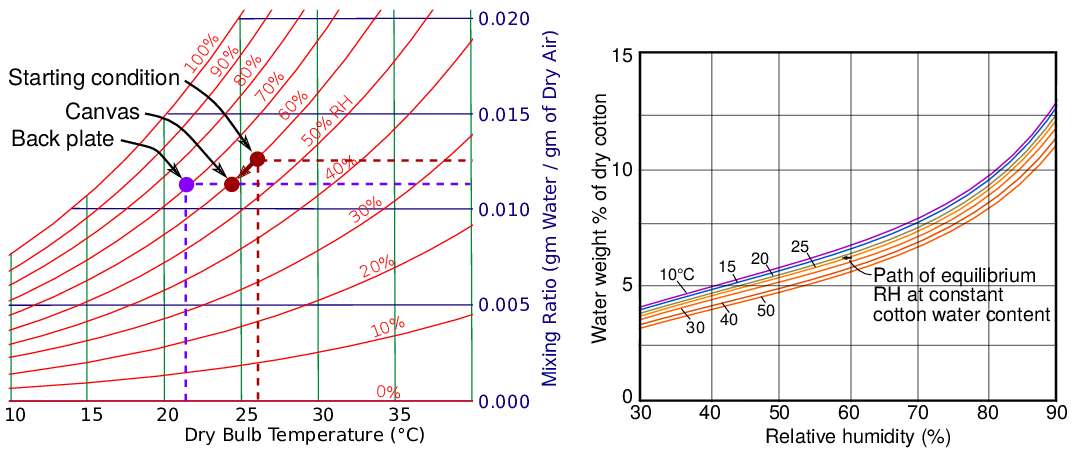
Figure 6. A simplified psychrometric chart (left) and part of the sorption curves for cotton, redrawn after Urquhart and Williams[3].
The starting point for the graph in figure 5 is a uniform environment throughout the assembly at 26 °C and 60% RH. When the temperature at the canvas surface declines to 24 °C at the low point of the temperature cycle, the RH in equilibrium with the canvas surface falls only about 1%, as defined by interpolation on the graph of sorption isotherms in figure 6. So the system moves on the psychrometric chart diagonally down and to the left, following close to the curve for 60 % RH to the point marked ‘canvas’. This corresponds to a lower mixing ratio.
The mixing ratio does not vary with temperature change. A falling temperature will increase the density of the mixture but will not change the ratio between water molecules and air molecules. A changing mixing ratio indicates that vapour is entering or leaving the air through humidity buffering by materials. Also, its variation in space indicates the degree of mixing of the air within the enclosure. In this context, one can regard air as entraining water molecules and helping to distribute them evenly throughout the space. There is no interaction between water vapour and air other than random elastic collisions; one should not regard air as a solvent for water vapour, only as a transport medium.
As the air close to the canvas disperses out into the space behind it, the mixing ratio does not change, because there is no source or sink of water molecules to change the ratio of water molecules to air molecules. When this packet of air reaches the surface of the back plate it is at a point on the diagram which is horizontally at the same level as the ‘canvas’ point, because the mixing ratio has not changed, but it is at a lower temperature. This point intercepts the curve for 72 % RH.
The mixing ratio has no significance for the wellbeing of the art which this air touches. The potency of water vapour for chemical reaction and sorption into solid materials is expressed by the relative humidity. One has to switch focus between vapour concentration, MR, as the cause of vapour movement in space, and vapour potential, RH, as a cause of change to artefacts.
In a confined space subjected to a sudden temperature gradient the exchange of vapour between solid and air is negligible. In this particular picture enclosure of 0.006 cubic metres, a five degree temperature change around 25 °C will change the water content of the painting canvas by 0.01% as it maintains a constant RH in the enclosure. Contrast this modest disturbance with the situation of the unprotected painting, exposed to a varying temperature and the constant mixing ratio of the room air, as in figure 4. The painting canvas will exchange much more water, 1.8%, because its surface RH will change substantially, while the mixing ratio will not change, being held constant by flushing with room air. Good stability of RH is achieved by very little water exchange by the canvas within a small enclosed volume.
Evidently, a tight enclosure around the painting allows it to control its canvas surface RH with hardly any moisture exchange. It is the surface RH which matters; how it is achieved is irrelevant. The addition of an impermeable, non-absorbent back plate is beneficial to a painting on canvas subjected to a changing wall temperature.
Modelling the air flow within the enclosure
Figure 7 summarises results from a computational fluid dynamic (CFD) calculations to support sensor measurements which indicated rapid air mixing within the enclosed space, except in the narrow channel between the painting canvas and the wooden cross beam.
With a temperature difference between back plate and the painting canvas of four degrees, the modelling shows vigorous convective circulation within the vertical space, with a central zone of slow mixing between the rising and falling air streams. It also shows the steeper temperature gradient close to the surfaces with a flatter gradient in the middle. This emphasises both the difficulty of knowing exactly the RH at the surfaces and the importance of realising how rapidly the RH changes as one approaches in millimetre detail a surface at a different temperature to that measured in the room.
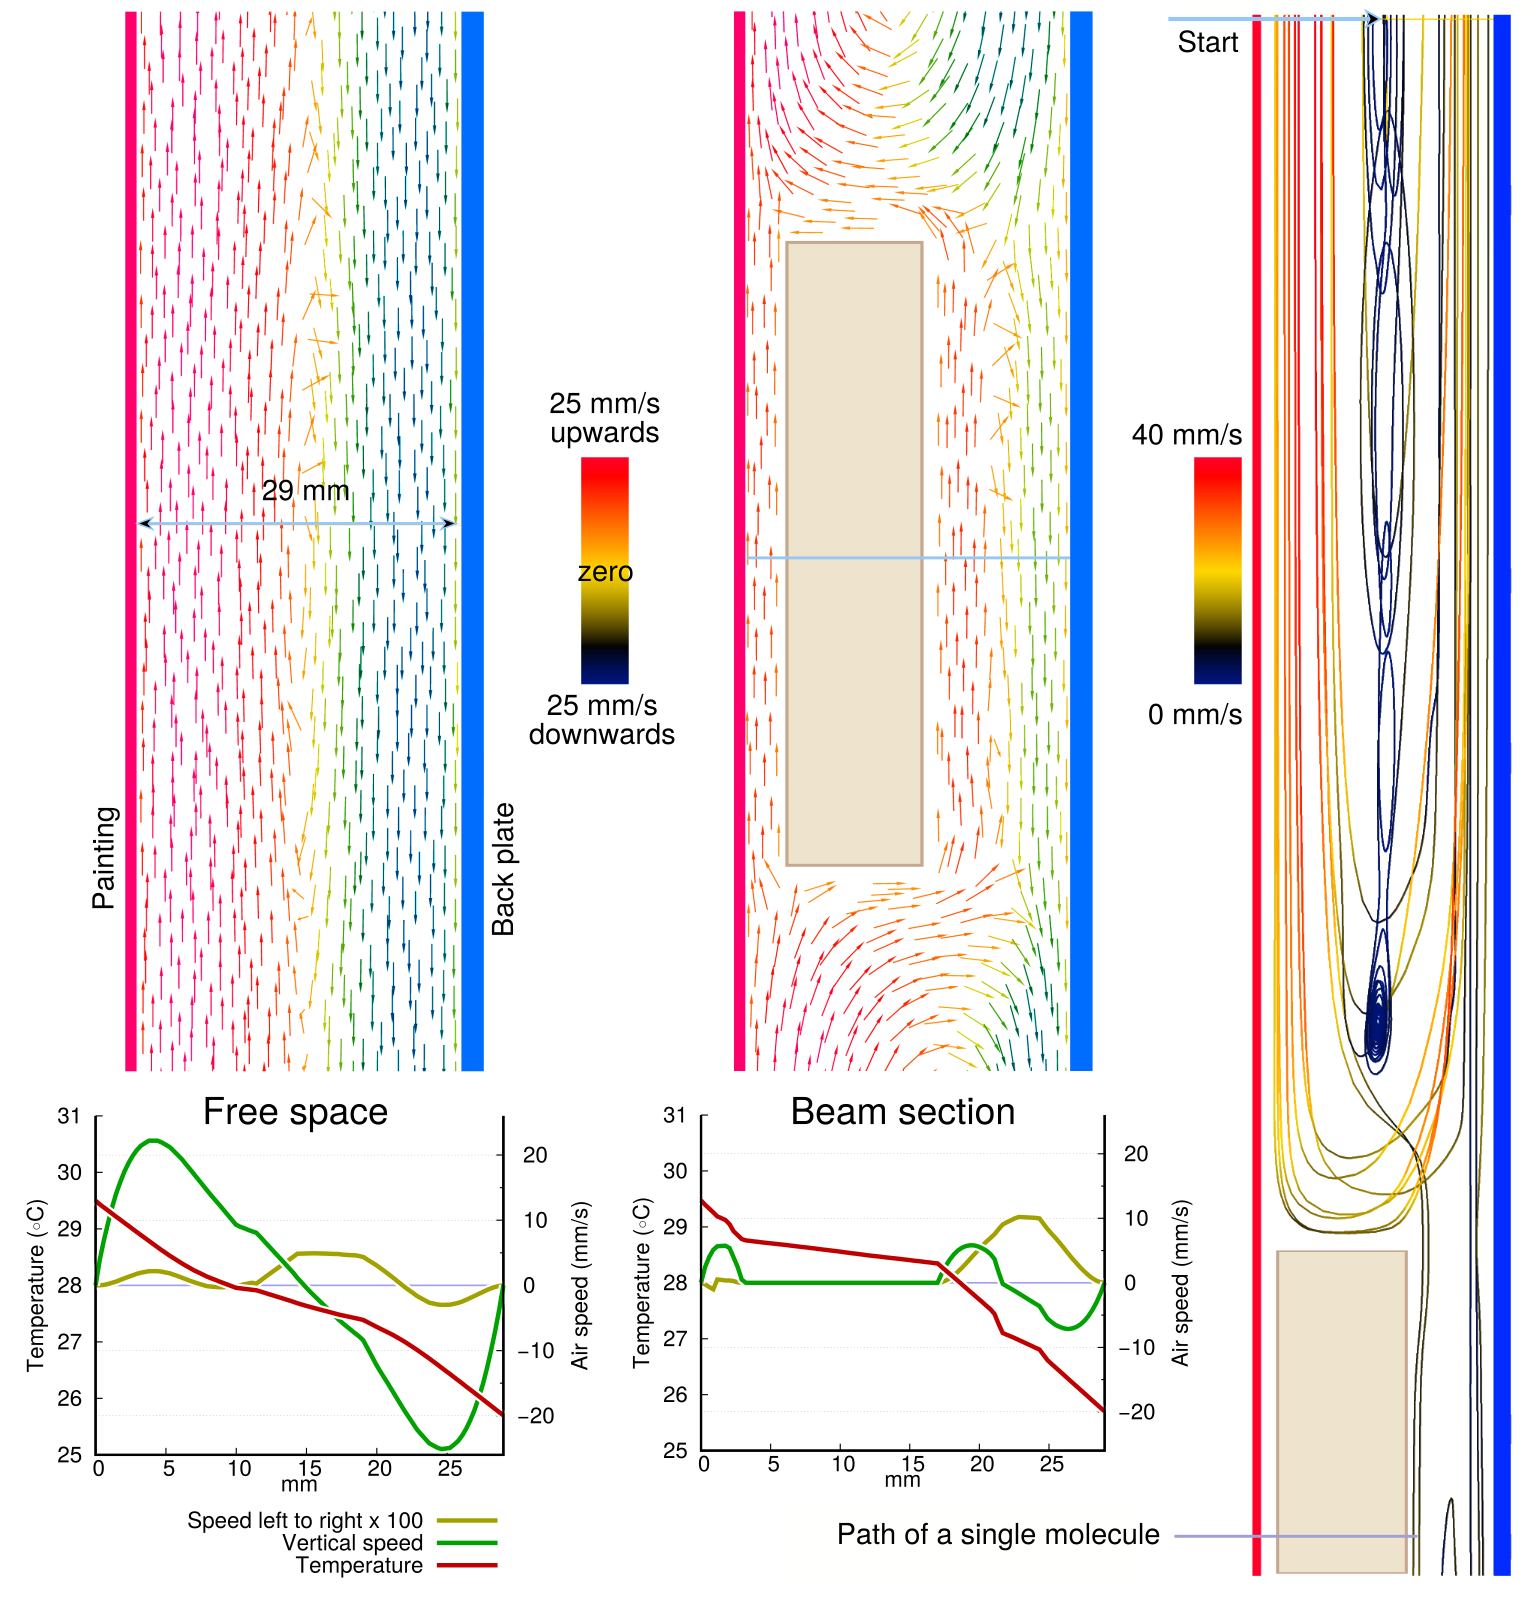
Figure 7. The computed variation in temperature and air speed within the space behind the back protected painting canvas. The arrow colour indicates the velocity at each point. Smoothed curves of vertical and horizontal air velocity at a single cross section line is shown on the graphs below. On the right, the trajectory of a single molecule is shown .
The left column in figure 7 shows the situation in the clear void, with vigorous vertical air movement but with mixing horizontally across the section. Movement in and out of the plane of the section is not displayed. The horizontal movement shown on the graph below the arrows image seems to be very slow, only a hundredth of the vertical speed, but this is misleading because the speed is the net residual velocity of many molecules in the horizontal direction, while the vertical movement is of molecules streaming mostly in the same direction as a relatively uniform mob.The centre column of figure 7 shows the effect of the beam. It considerably diminishes the flow on both sides, causing air to circulate mostly in two separate cells above and below the beam. The air flow is one way and sluggish in the 3 mm gap between beam and canvas, just one sixth of the unimpeded flow in the 29 mm space between canvas and back plate.
The blocking action of the beam is illustrated in a different way in the column to the right. This shows the path of a single molecule released at the top of the image and in the centre of the space. It spends a lot of time trapped, slow moving, in a vortex just above the cross beam.
The thermophoretic effect should cause a left to right net flow of molecules (a positive value in the graph) from the warm painting towards the cooler back plate. In the graph of the empty space this seems to happen near the canvas but at the back plate the net velocity is away from the colder surface. In the section through the beam the net movement is, as one would expect, always from the warm beam back surface towards the cooler back plate.
The simulation shows that the dominant molecular movement is an elliptical circulation with laminar flow parallel to the two vertical surfaces. It gives no information on the rate of release and absorption of water molecules through the canvas surface.
Insulation between wall and back plate
The large amplitude of the RH variation at the back plate means that if the wall is very cold, there is a possibility of condensation on the inside surface of the back plate. The water can then run down and collect at the bottom of the frame, causing damage to the lower edge of the painting.
The 10 mm gap between painting and wall is therefore important because it reduces the temperature swing at the back plate. It also allows room air to warm the wall surface where air circulation is restricted by the proximity of the painting and thus inhibit condensation on the wall surface.
When the back plate was set directly against the wall, its RH exceeded 80% when the wall temperature reached 16 °C. For this reason, fitting a back protection should be combined with thermal separation from the wall, by a space or by insulation.
Protection against condensation on the interior of the back plate can be provided by putting thermal insulation outside the enclosure, between the wall and the aluminium back plate.
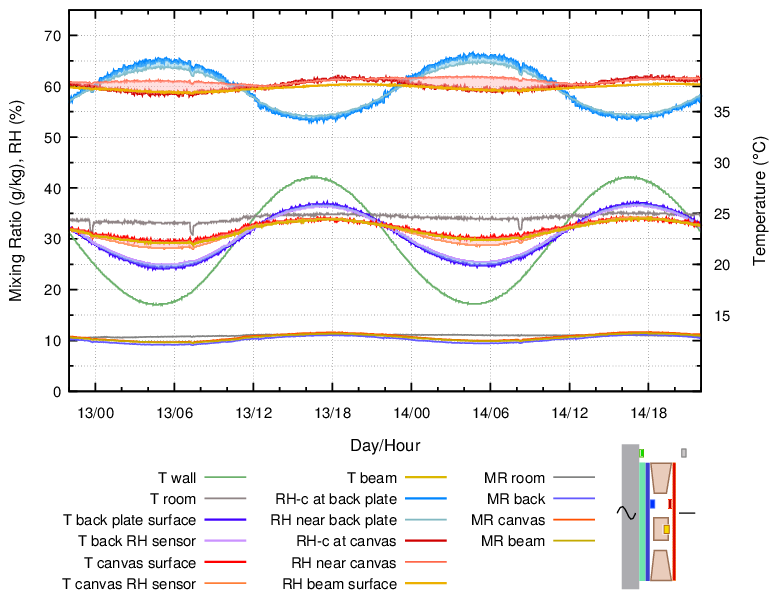
Figure 8. The back plate was separated from the wall by a 20 mm slab of expanded polystyrene. 24 hour cycle.
The RH variation with external insulation of the back protected painting was quite moderate, because the temperature variation at the back of the frame was half of that when the back plate touched the wall. However, the point of condensation danger was shifted to the wall surface behind the insulation, which was now much colder than the exposed wall. This is a particular danger in humidified exhibition rooms in cool climates.
Many conservators use insulating back plate materials, such as multi-wall polycarbonate plates. These will behave in principle just like the combination of aluminium plate and polystyrene backing behind.
Hygroscopic back
Historically, many backboards have been moisture absorbent materials such as wood and card. To simulate these materials, a piece of washed, dense cotton canvas (632 g/m2) was stuck to the inside surface of the aluminium plate.
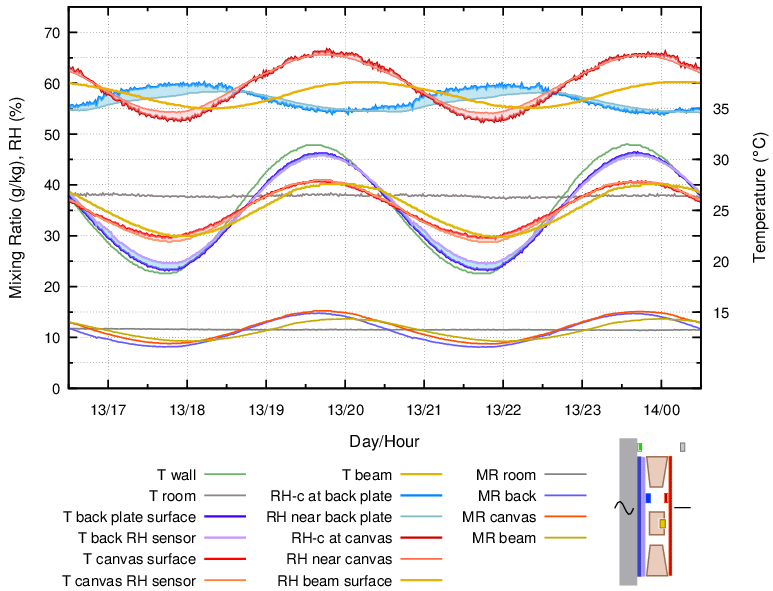
Figure 9. Buffering by canvas stuck to the inside surface of the back plate, which was set against the wall. 4 hour cycle.
The RH cycle amplitude behind the painting canvas was now rather large, but the RH cycle measured close to the cotton on the back plate was smaller than when the back plate was bare.
The process here is a more complicated version of that proposed for figure 5. In that construction, the painting canvas was the main provider of water vapour. When the back plate also is hygroscopic it will compete for influence over the humidity within the enclosure.
As the temperature descends to a minimum, the RH at the back plate will tend to rise, but the back plate is hygroscopic and will absorb water vapour to move its surface RH towards equilibrium with its moisture content. The surface air of reduced mixing ratio will migrate to the painting canvas, which is about three degrees warmer. During the journey through the temperature gradient to a warmer surface its mixing ratio will not change, so its RH will decrease. At the painting canvas surface, vapour will be released into the unexpectedly dry air, in an attempt to keep the surface RH in equilibrium with the painting canvas moisture content. Its moisture content will therefore decrease.
The two hygroscopic surfaces were competing as humidity buffers, which is why the observed RH change at the back plate was less than it was in the absence of the buffer surface. The painting canvas RH span was however of greater amplitude than when there was no buffer at the back.
The mixing ratios at canvas and back plate were changing in the same direction but were not identical, indicating that the air mixing is not entirely effective in ensuring a homogenous atmosphere at this rapid temperature cycle and with energetic exchange of water molecules between air and materials. Nevertheless, the mixing ratios were moving in phase, though the RH values at the two hygroscopic surfaces were in opposite phase.
This graph is an example of an important and widespread phenomenon - the destabilisation of the RH around an artefact when its buffer ‘protector’ is transiently at a different temperature. It is a risky decision to put a water absorbent back plate on a painting.
Buffering against air leakage
There is much discussion among conservators about using hygroscopic back protection. Concern over leakage into the painting enclosure of a hostile room RH has dominated the discussion. However, humidity buffers play two distinct, separate roles: they serve to maintain a constant RH during temperature change, as shown by the temperature insensitivity of the cellulose isotherms, and they replace vapour leaking between the enclosure and the room air, even when there is no temperature gradient at all. This is because of the huge quantity of exchangeable water in the buffer compared with the tiny amount of water in the small air space. There is abundant literature describing how to buffer against leakage, with calculations to predict how much buffer is needed to give a desired time delay for the move towards equilibrium with the room climate.
If water vapour exchange with the room is an important consideration, due to a persistently unsuitable environment, one can add extra humidity buffer, so long as it is always at the same temperature as the painting.
Putting an extra humidity buffer close to the canvas, and thus at a similar temperature, will not cause competition between the absorbent surfaces and it will slow down the RH change caused by leakage. For this to succeed, there must be thermal insulation to shield the buffer from the back plate temperature.
In order to show this, the same canvas that was used as the back buffer was instead fastened to the front of a 20 mm thick slab of expanded polystyrene insulation which fitted between the back plate and the painting canvas. It was spaced 3 mm behind the painting canvas to avoid spoiling the taut contours of the painting. The twenty four hour cycle is shown in figure 10
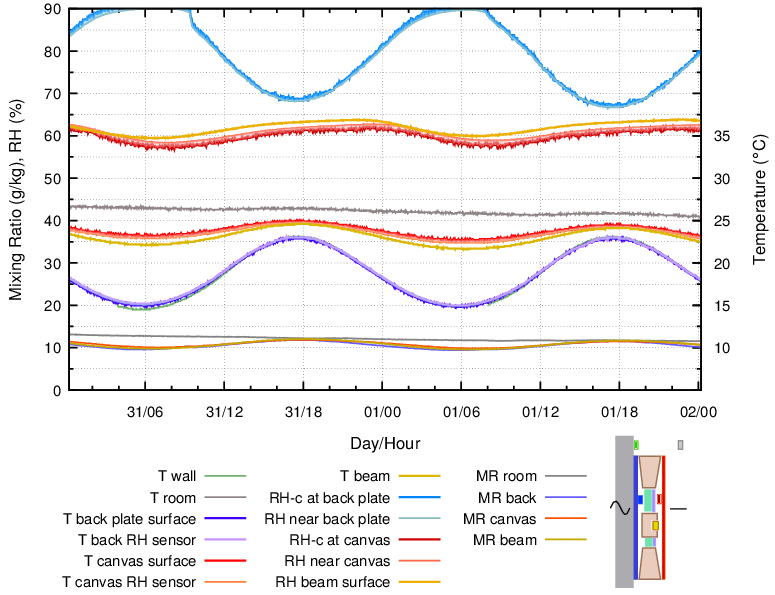
Figure 10. Enclosure with a buffer layer of cotton fixed over 20 mm of insulation and spaced 3 mm from the canvas, measured over a 24 hour cycle and at a low wall temperature.
The RH stability of the painting canvas was now very good, as was the RH between canvas and cross beam.
This combination of sealed back, impermeable insulation and a buffer layer close in temperature to the painting canvas, gave stability to both temperature and relative humidity at the back surface of the painting, as well as providing a water reserve to compensate for leakage of room air into the enclosure.
The disadvantage of this arrangement is a large temperature difference between buffer and back plate and a correspondingly high risk of condensation on the inside surface of the back plate.
The mixing ratio in the narrow unbuffered void between the insulation and the back plate was varying in the same way as in the buffered space behind the painting canvas. This shows good air mixing throughout the space, even with reasonably close fitting insulation panels within the frame.
In winter the wall may always be cooler than the room temperature and sometimes below the dew point of the air just behind the painting. Water will condense onto the back plate from vapour provided by the buffer at the warmer room temperature. From there it can dribble down to collect at the bottom rim of the assembly. The painting canvas is dehydrated by this process as it releases water vapour to maintain its surface RH. Insulation is not a universal good, just as buffer materials have to be positioned with understanding of the microclimatic implications of their presence.
This construction is best reserved for paintings with a relatively benign wall temperature but a seasonally variable room RH, where extra buffering will defend against RH change caused by air exchange through the painting, or around its frame.
Condensation has often been observed on the wall behind paintings both with and without back boards. The painting provides enough thermal insulation to keep the wall behind it cooler than the wall directly exposed to the room air.
Conservators, aware of the risk of condensation on the cool inner surface of the back board, have tried to avert it by seemingly intuitive solutions, such as cutting the corners of the back board, or by drilling holes through it. This won’t help if the room air has a dew point above the back plate temperature.
The effect of glazing the painting
Nowadays many paintings have glass in front. This extra insulation layer will result in a greater temperature variation at the painting canvas as the wall temperature varies, but a smaller temperature difference between front and back of the enclosure. This results in a smaller RH cycle amplitude at the back plate and thus a diminished risk of condensation. Figure 11 can be compared with the unglazed equivalent, figure 10.
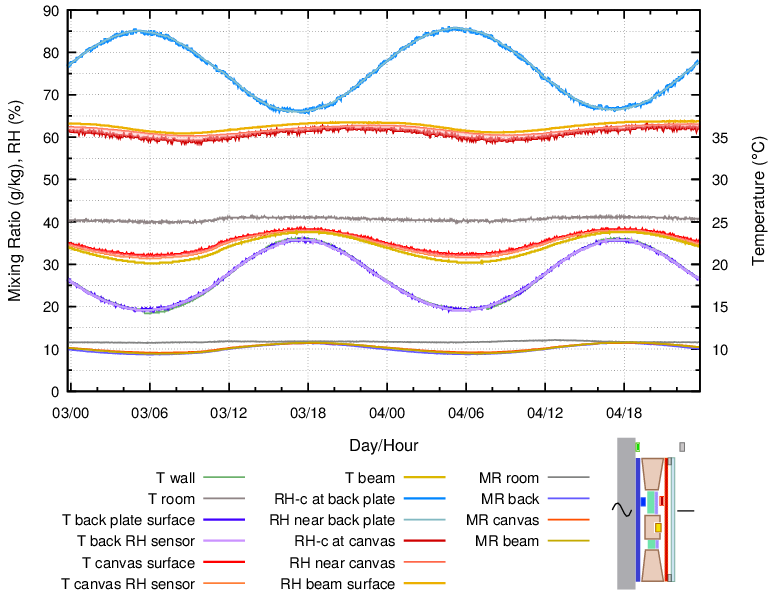
Figure 11. Enclosure with a buffer layer of cotton fixed over 20 mm of insulation and spaced 3 mm behind the painting canvas. This is the same construction and wall temperature cycle as in figure 10 but with added glass, 3 mm thick, spaced 6 mm in front of the painting. The temperature cycle amplitude at the canvas was increased, and its average temperature was decreased, which reduced the RH variation at the back plate.
The glass reduced leakage of air through the paint surface, so this construction is well suited to paintings which hang in a room with unsuitable RH.
When the wall has a more stable temperature than the room
In massive buildings the wall may have a more stable temperature at its inner surface than the air in the room. This situation was mimicked in figure 12. The painting was exposed, without internal buffer and without glass, to a varying room temperature while set against a constant temperature at its back plate.
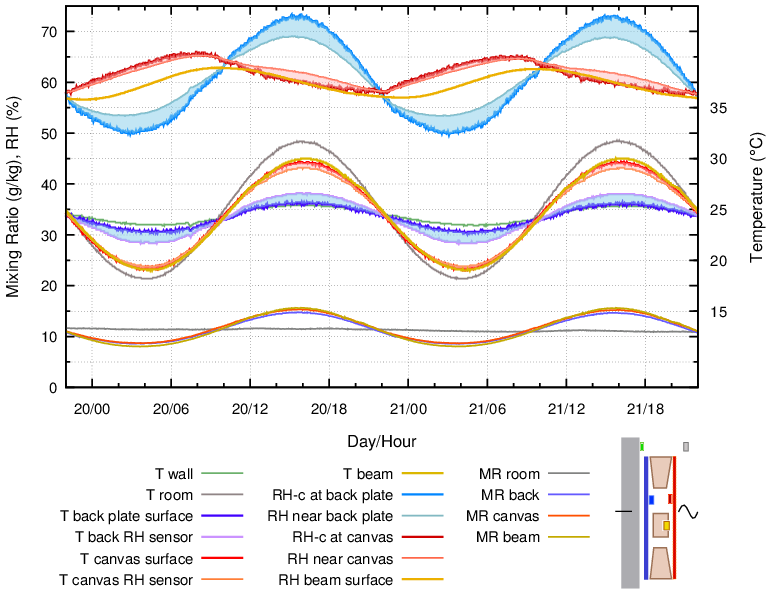
Figure 12. The empty enclosure, exposed to a varying room temperature and a nearly constant wall temperature. 24 hour cycle.
There are several puzzling aspects of this diagram. The canvas and the beam RH were nearly in phase with each other but displaced from the temperature and from the back plate RH phase. Yet the mixing ratio was uniform throughout the space and in phase with the temperature.
As the canvas temperature fell, it absorbed water vapour, as shown by the falling MR, but not enough to stem the rise in RH at its surface caused by the temperature reduction, which was now larger than when the wall was varying in temperature. As the fall in temperature diminished and then reversed, the canvas continued to absorb vapour, because its water content was out of equilibrium with its surface RH. After a half cycle, the temperature rose above ambient and the canvas quickly began to desorb vapour, which pushed its equilibrium surface RH down during the whole of the above ambient part of the temperature cycle. The result was a non-sinusoidal RH cycle about a quarter cycle in advance of the temperature cycle and the MR cycle.
Adding glass in front of the painting gave a similar pattern but with reduced amplitude of the temperature cycle.
Our next experiment re-instated the internal insulation and buffer layer close to the canvas.
Figure 13 shows the relatively unsteady RH at the canvas when it had the same back protection of buffer and insulation as in figure 11 but was instead exposed to a variable room temperature and a constant wall temperature.
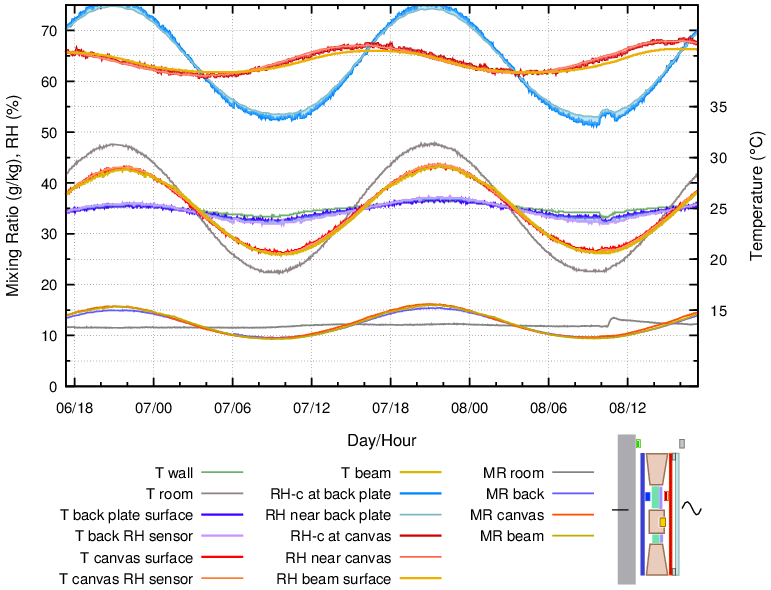
Figure 13. Enclosure with a buffer layer of cotton fixed over 20 mm of insulation and spaced 3 mm from the canvas, which was covered by glass at 6 mm separation. The glass was exposed to a temperature cycle with the back plate held at a nearly constant temperature.
In this construction, the moisture reaction of the adjacent canvas layers dominated the entire space, so the RH at the back was variable, even though its temperature was nearly constant. The painting canvas RH was calmer but displaced by a quarter of a cycle.
The effect of the wood components
Many observers have commented on the better state of preservation of oil paintings on canvas in areas which are backed, at a millimetre or two spacing, by the wooden frame on which the canvas is stretched.
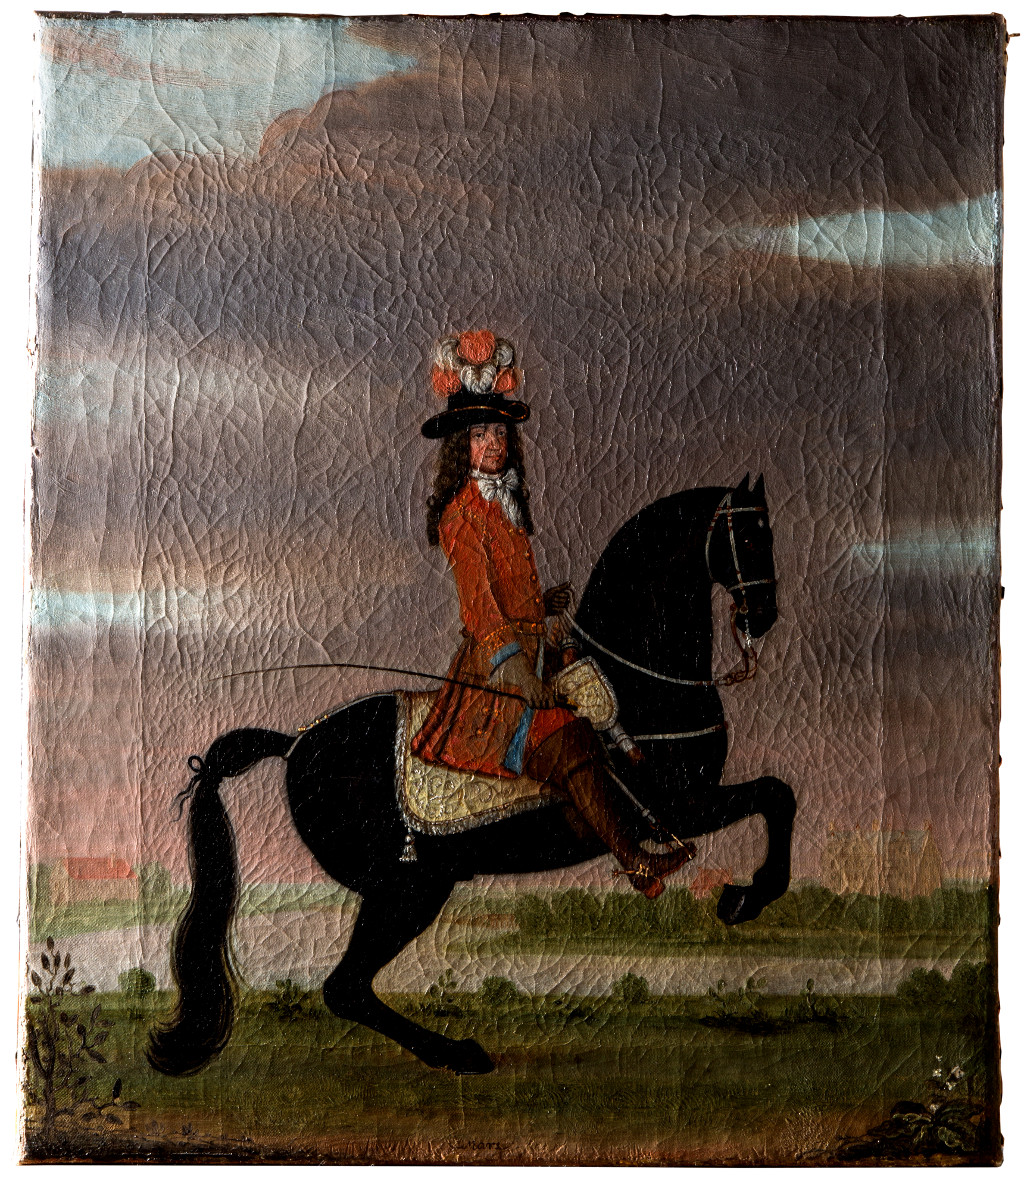
Figure 14. An anonymous painting from around 1690, illuminated by raking light to show the protective effect of the wooden frame behind the canvas. 390 x 460 mm. From the Rosenborg Palace collection, Copenhagen. Photo by Berit Møller.
All the graphs showed a reduced RH cycle amplitude in the 3 mm space between the wooden cross beam and the canvas. The cross beam was mounted horizontally, so convecting air currents would flush this space. Nevertheless, the 24 hour cycles showed a significant calming of the RH in this region.
The temperature gradient disturbance caused by the beam was quite small. Ligterink and Di Pietro [1] attributed the stretcher effect to the thermal insulation afforded by the wood, which reduces the RH fluctuation through moderating the temperature, without a significant contribution from sorption processes. They applied the temperature gradient as a single step change, followed by a steady state temperature difference.
Our cyclic experiments are closer to the real situation and reveal, in figure 4, that for the unprotected painting, the temperature was not much different between the beam-protected area and the exposed canvas, while the RH variation at the beam surface was much less than at the exposed canvas. The mixing ratio revealed moisture exchange with wood and canvas. This combination of buffering by both wood and canvas, together with constriction of air movement in the narrow space, as shown by the diverging mixing ratio curves, seems an entirely adequate explanation for the better preservation of canvas paintings over the frame beneath.
The throttling of the air movement in the 3 mm gap between canvas and cross beam is shown in figure 7.
Effect of air leakage
We strove for airtightness to simplify interpretation of the experiments. However, we did not actually achieve better than 0.4 air changes per hour, even though our canvas was painted with fresh acrylic over the commercial ground. Air exchange will tend to force the mixing ratio behind the painting towards that in the room. Nevertheless, we noticed no tendency for the mixing ratio within the enclosure to drift towards ambient. In a buffered space with a large reservoir of sorbed water in materials, this process can take a long time compared with the air exchange rate as measured by trace gases that do not interact with the materials.
In the insulated and buffered assembly there is a rather small volume of air compared with the perimeter seal length, so the air exchange rate is quite large. However, the small air volume has a small vapour content, so the buffer materials, the canvas and the wood, can cope with many air changes before there is a noticeable movement in the average mixing ratio of this volume towards that of the enclosing room.
On the positive side, the relatively rapid, yet safe, air exchange rate prevents the accumulation of damaging vapours emitted by the components of the enclosure: painted canvas, wood and insulation. If this remains a concern to the conservator, an active carbon loaded cloth can be sneaked into the space. If the painting is likely to be against a wall which is normally cooler than the room, the carbon absorber is best placed close to the back plate, because cool carbon absorbs better. The cloth that supports the carbon must be non water absorbent in this position.
The larger environment
The microclimate of the exhibition room should be taken into consideration. A wall which is frequently so cold that its surface temperature is sometimes below the dew point of the inside air requires special consideration. A painting hanging against such a cold wall, or even spaced away from the wall, will inhibit the wall warming from contact with the room air, without entirely suppressing penetration of room air to the cold wall. There is then a risk of condensation behind the painting.
Some outer walls provide a more stable climate behind the painting than the room provides to the painted surface [4]. The site of the painting should be studied before making an elaborate construction behind the painting. It may be that glazing the front of the painting will be a more effective preservative than a backing plate.
Another relevant consideration, which is not treated here, is the effect of sudden heating by sunlight, or by spot lights, which can cause moisture movement from the painting canvas to the interior of the void behind it. This was described by Padfield et al. [2].
Light energy absorbed by different colours will cause horizontal movement of water vapour behind the painting. A one degree difference in temperature corresponds to a 3% difference in RH in the space immediately behind the painting at that point.
Discussion
Figure 15 summarises the performance of the enclosure when it was exposed to a cyclic temperature gradient. It shows the span of the RH and temperature changes for each enclosure structure, normalised to the wall temperature span.
The merit of each construction is judged by how small a RH span arises at the back surface of the painting canvas. In several constructions there is a large span in RH close to the back plate. This can cause damage within the assembly, but not directly to the painting. A small temperature span at the painting is also good, but temperature is not as strong a cause of dimensional change as the RH span, under the same environmental cycle.
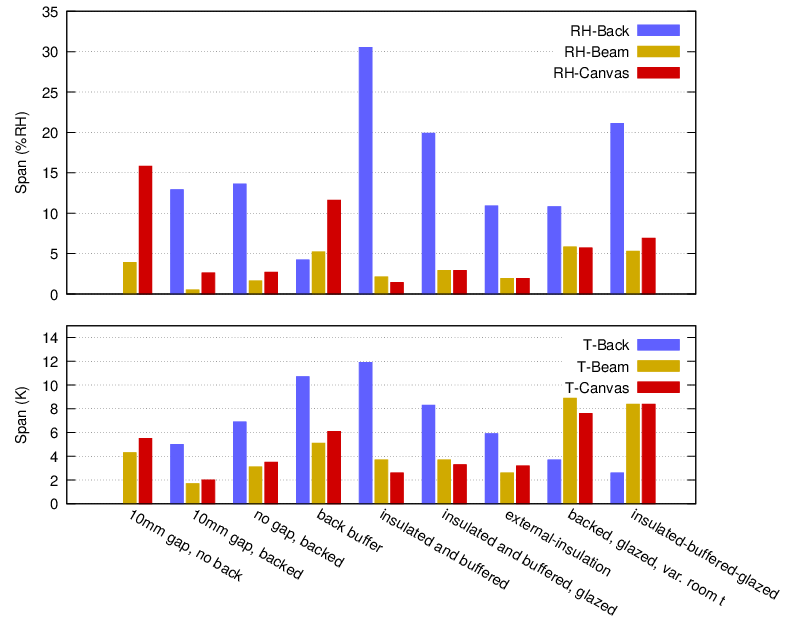
Figure 15. A synoptic view of the variability of the temperature and RH at three places in the painting enclosure. The RH variation is the measured variation at sensors adjacent to the backboard, near the painting canvas and at the painting side of the wooden beam. The rightmost two sets of columns represent a steady wall temperature with varying room temperature.
The diagram shows clearly the main features of the various treatments. The unprotected painting showed the largest variation of RH, entirely caused by its temperature divergence from the room temperature.
Backing the frame with a moisture inert and impermeable metal sheet greatly stabilised the canvas RH but caused a large RH fluctuation at the surface of the back plate. This could cause condensation if the wall becomes sufficiently cold.
Insulating between the wall and the back plate gave good stability to the painting canvas and much reduced the risk of condensation on the back plate, while transferring the condensation risk to the wall behind the insulation.
Adding buffer capacity to the back plate, in the form of a layer of cotton canvas, reduced the condensation risk there but increased the RH variation at the painting canvas.
Bringing the buffer close to the painting canvas, with insulation behind it, would better stabilise the painting canvas RH against leakage, but exposed the back plate to a very high RH fluctuation with correspondingly high condensation risk.
Adding glass in front of the painting slightly increased the temperature span at the painting canvas, gave a reduced span at the back plate and reduced the RH variation there.
The two last clusters on figure 15 show the microclimate when the room temperature was more variable than the wall temperature. The temperature and RH spans were increased for the painting canvas and the wooden beam but the back plate had a moderate RH span, increased when there is internal insulation and buffering.
Conclusions
Our conclusion is that the best general back protection for a painting of moderate size is an impermeable, non-hygroscopic plate, with 10 mm spacers to separate it from the wall. This is the second cluster from the left in figure 15. This plate can be metal or it can be a transparent plastic such as polycarbonate, if the curator wants to be able to see the back of the canvas. Metal has the advantage of reducing radiative heat transfer; its total impermeability is not a significant advantage in this situation.
Hygroscopic back boards are dangerous because even a small fluctuation in temperature difference between back board and painting canvas will cause a large RH swing at the canvas. The Canadian Conservation Institute [5] recommends hygroscopic backs. This advice is good for situations where the temperature is uniform but the room RH is seasonally low, or high. It is therefore important to consider the geographical setting of the painting, as well as the room conditions in front of it.
The current authoritative advice on back protection of paintings fails to warn about the high RH which can arise at the back plate when there is a transient low temperature arising from the outside weather.
There is no reason to ventilate the space behind the painting. The space is unlikely to have an air exchange rate lower than once per day, because of the large perimeter seal compared with the enclosed volume. The often expressed fear of mould growth in the sealed space is justified, because of the high RH at the back board when it is cooler than the painting. However, ventilation with room air through perforations will not help, because it introduces air, often humidified in museum galleries, of a moisture content which may well have a dew point close to the backboard temperature. If condensation on the back plate is judged likely, a remedy can be borrowed from the air conditioning industry: separate the bottom of the back plate from the frame by a thin fabric whose threads wick the descending water down past the frame to evaporate on the outside of the assembly. This process will however remove water from the painting canvas, so it is best to add insulation between back plate and wall.
There is a widespread assumption that humidity buffers are always beneficial, but this is wrong wherever there is a temperature difference between the protective buffer and the object in its care. The climatic situation must be analysed. Only in modern purpose-built museums is temperature uniformity likely. In historic houses and churches, the microclimate must be measured and studied to confirm the safety of adding humidity buffers behind a painting. Many outbreaks of mould growth on art can be directly attributed to a low temperature at their surface, combined with a moderate RH in the warmer adjacent air.
We have concentrated our attention on moderating RH change directly behind the painting canvas, but temperature variation is also important to the stability of the painting. Fortunately, the constructions which perform best to moderate RH also perform well on temperature stability.
References
[1] Ligterink, Frank J., and Giovanna Di Pietro. 2007. “Canvas Paintings on Cold Walls : Relative Humidity Differences Near the Stretcher.” In Museum Microclimates, edited by T. Padfield and K. Borchersen. National Museum of Denmark. https://www.conservationphysics.org/mm/ligterink/ligterink.pdf.
[2] Padfield, Tim, Henriette Berg, Nina Dahlstrøm, and Anna-Grethe Rischel. 2002. “How to Protect Glazed Pictures from Climatic Insult.” In Proceedings of the Rio de Janiero Conference of the International Council of Museums - Committee for Conservation. Ed. Roy Vontobel, London: James & James (Science Publishers), 1:80–85. https://www.conservationphysics.org/framepic/glazedpics.pdf.
[3] Urquhart, A. R., and A. M. Williams. 1924. “Absorption Isotherm of Cotton.” J. Textile Inst., 559–72.
[4] Padfield, Tim, and Annabel Robinson. 1996. “The Climate Behind Pictures Mounted Against the Outer Walls of the Chapel of Ledreborg, Denmark.” In Preprints of the Icom (International Council of Museums) Committee for Conservation, Edinburgh, 1:72–75. https://www.conservationphysics.org/ldrbrg/ldrbrg.pdf.
[5] Hartin, Debra Daly. 2016. “Backing Boards for Paintings on Canvas – Canadian Conservation Institute (CCI) Notes 10/10.” https://www.canada.ca/en/conservation-institute/services/conservation-preservation-publications/canadian-conservation-institute-notes/backing-boards-paintings.html.
[6] Padfield, Tim, and Nicolas Padfield. 2019. “A Workshop Cool Plate.” https://www.conservationphysics.org/coolplate/coolplate01.html.
Acknowledgements
These experiments were performed at the School of Conservation of the Royal Danish Academy of Fine Arts. The experimental apparatus was constructed at the Fablab at Roskilde University, Denmark. Henning Matthiesen helped with the air exchange measurement. Useful comments were sent by Thomas Biney, David Bugeja, Dario Camuffo, Sarah Staniforth, Frank Ligterink, Giovanna Di Pietro, Jørgen Wadum, David Thickett and Stephen Hackney.
Experimental methods
The painting and the buffer canvases
The painting canvas was an open woven linen with factory applied ground. It weighed 447 g/m2. The loose weave was to limit shrinkage at high RH. The material reacted quickly to RH change, reaching about 80% of the expected equilibrium moisture content when subjected to an RH cycle of four hours in a dynamic vapour sorption apparatus (Surface Measurement Systems Ltd UK).
The buffer canvas was a very densely woven cotton fabric, 632 g/m2. It only came 60% towards equilibrium, even when exposed on both sides in the sorption apparatus. Because of the difference in weight per unit area, the buffer canvas had more exchangeable water available within the painting assembly. In figure 9 the buffer canvas dominates the RH competition between the two surfaces at different temperatures.
Experimental geometry
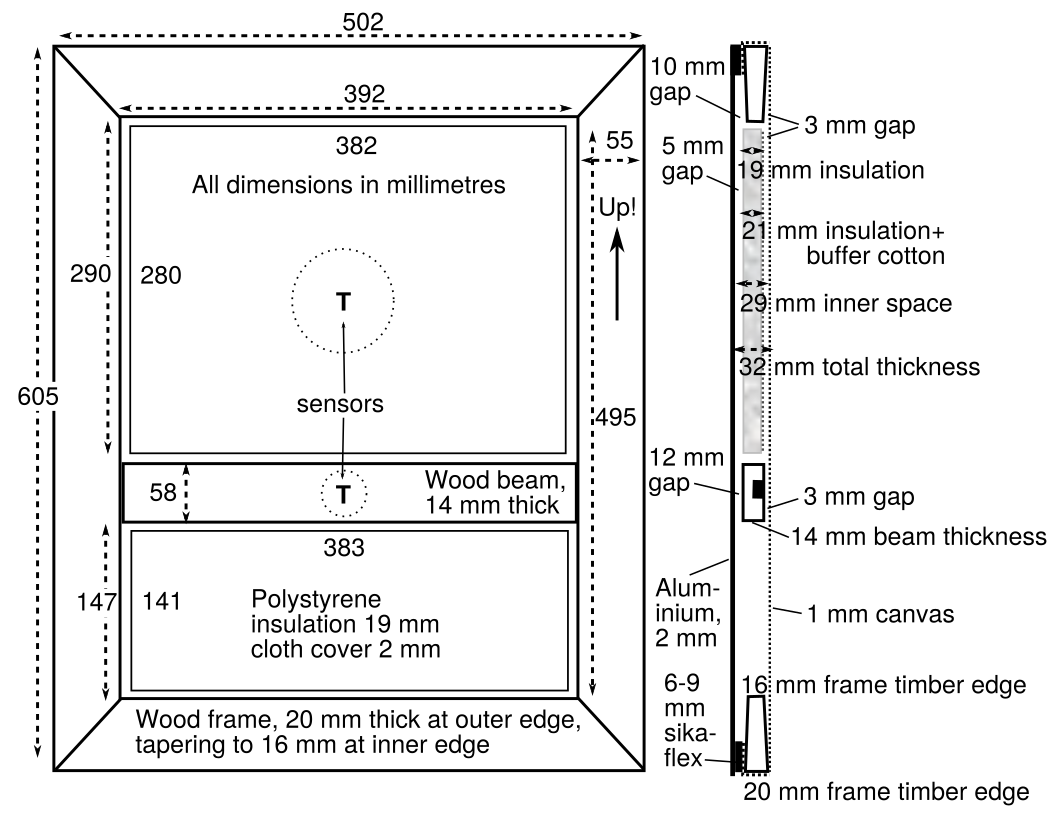
Figure 16. Dimensions of the painting assembly.
Sensor calibration
The RH sensors are Honeywell HIH series 8120. They were calibrated over two saturated salt solutions: Sodium chloride at 76% and magnesium chloride at 33%. The tests were made at three temperatures covering the span of the experimental cycles. The claimed accuracy is ± 2 %. Three of the four were within 1% of each other throughout the tests, the fourth, used to measure the room RH, was about 2% low. The sensors have built in signal processing and cannot be adjusted. However, inconsistencies were very small compared to the RH values discussed in this article, so no corrections were applied to the graphical results.
The temperature sensors were calibrated against each other through the temperature range, since three different sensor technologies were used in close proximity: type K thermocouples, Platinum 100 ohm resistance sensors and an unidentified type in the Honeywell sensors. The Honeywell sensors proved to be seriously non linear, with kinks in the temperature response, reproducible but different in the four sensors. Only a continuous ramp in temperature revealed the deviations from a linear response. This was a surprising defect in a sensor which is used in many industrial products. We took the average of the thermocouples, and the Pt100 sensors, as the true values and adjusted the raw data to concordance among all the sensors. Even a 0.3 degree anomaly in the temperature record produces strange artefacts on the graphs, because the calculated surface RH depends on two temperature sensors being equally responsive.
The temperature controlling device
The ‘wall’ is an aluminium plate, A1 size (594 x 841 mm), 5 mm thick, grooved at the back to hold a coiled copper pipe, 5 mm internal diameter. Tempered water is pumped through the pipe. The water temperature is adjusted by recirculating it through an electric heater (600 W) or a heat exchanger connected to an industrial cooler (680 W) held at 7 °C. The recirculation path is controlled by magnetic valves energised by solid state relays which in turn are controlled by a Raspberry Pi micro-computer running a Python script. The plate temperature is measured by duplicate four wire platinum 100 ohm sensors. A PID controller in the script ensures smooth temperature variation. Remote control of the temperature cycle is via a web page. The apparatus and program code is open source. It is described by Padfield and Padfield [6].
Unlike a real wall, this device imposed the programmed temperature on the back plate, regardless of the construction of each experiment. A real wall would interact with the heat flow through the entire arrangement, having some thermal resistance and capacity.
The data logger is also an open source project, based on a Raspberry Pi micro-computer and scripted in Python. The sensors are generic type K thermocouples, Platinum 100 ohm resistance sensors and Honeywell HIH 8120 combined humidity and temperature sensors. The signal processing for the thermocouples is by Adafruit MAX31856 boards, and for the Pt100 sensors by Adafruit MAX31865 boards. The Honeywell sensors have built in signal processing and send a digital signal through the I2C protocol.
The Raspberry Pi uses a web server to display a control page which provides a choice of the sensors to log, the measurement interval, and download of accumulated data. This is accessible over the internet and allows remote control of the logging.
Air exchange measurement
We measured the air exchange rate with a moisture independent method. The painting assembly was flushed with nitrogen to displace most of the air, then the returning oxygen was measured with an optical method based on the quenching of fluorescence of a dye in the presence of oxygen. The air exchange rate was 0.4 per hour.
The measuring instrument was a PreSens detector (PreSens Precision Sensing GmbH, Am BioPark 11, 93053 Regensburg, Germany) which sends a short pulse of blue-green light through an optical fibre cable towards the sensitive dye which is held against an airtight acrylic window at the end of a brass tube sealed through the painting frame.
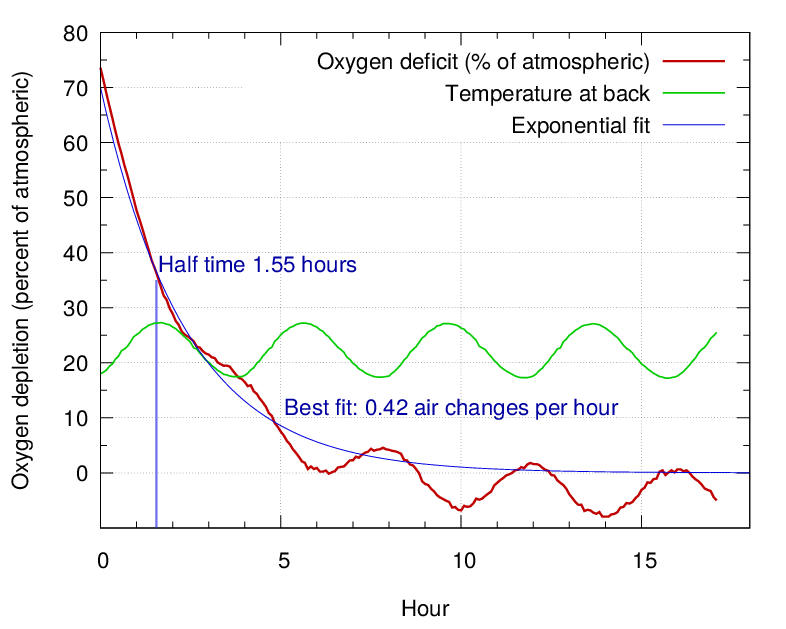
Figure 17. The air leakage rate, with a fitted curve showing the half time to equilibrium. The oscillation in the oxygen measurement is due to the large temperature dependence of the fluorescence quenching.
Air circulation simulations
The computational model was constructed with the air volumes and the main structural elements: canvas, wooden stretcher, elastic seal and the aluminum back plate. The physical properties used for these elements are given in Table 1.
The simulation was run in ANSYS® Fluent® academic version 19.0 with coupled solver. The thermal boundary conditions were given as constant temperatures at 29.5 °C and 25.7 °C to the painting canvas and the back-plate respectively. The minimum element size was 1mm, and a number of models with different inflation layers off the canvas and back-plate surfaces were computed to find the appropriate total thickness which can capture all the laminar flow near the walls. The SST k-omega turbulence model was used with low-Re correction.
| Material | Density (kg/m3) | Thermal Conductivity (W/mK) | Specific heat (J/kg/K) |
|---|---|---|---|
| Aluminum | 2719 | 202.4 | 871 |
| Sikaflex 11F | 1200 | 0.025 | 1800 |
| Canvas | 0.632 | 0.045 | 1340 |
| Spruce | 450 | 0.18 | 2300 |
Back protection canvas paintings data
Coolplate article sorbtion calculations