|
|
Humidity buffering by absorbent materials in walls and objects |
The use of porous materials in walls and ceilings is an unappreciated aid to maintaining constancy of relative humidity indoors and deserves the attention of architects and engineers.
Hygroscopic walls and ceilings give substantial stability to the indoor relative humidity (RH) in rooms which are ventilated at less than about one air change per hour. A few centimetres of material are sufficient to buffer the daily RH cycle, about 40 cm of wall will buffer the annual cycle of RH in a room with about 0.1 air changes per hour.
The factors that define the performance of humidity buffers in rooms with a significant air exchange rate are the water capacity and the water vapour permeability. The best common buffer materials are wood, cut across the grain, and unfired clay brick. A specially designed lightweight clay made from bentonite mixed with perlite gives an excellent performance.
The best performer of the commonly used building materials is cellular concrete. Nearly all other building materials have a negligible buffering effect at moderate relative humidity.
The present standard for ventilation of houses is based on the need to ventilate away the moisture generated by human activities, so a well buffered house could cope with a slower air refresh rate, resulting in even better buffering and less use of energy.
The typical modern house is built without any deliberate use of materials that will buffer variation of atmospheric humidity, yet the improved air tightness of buildings introduced to give more efficient energy use is precisely the factor that makes feasible the stabilisation of relative humidity by absorbent materials.
The use of absorbent materials is particularly relevant in museums. Humans are rather indifferent to the RH, judging the humidity indirectly from the sight of water stains or, more seriously, from an allergic reaction to dust mites. Objects in museums, such as veneered furniture and oil paintings are physically stressed by variation in RH.
Attempts to stabilise the climate of museum galleries goes back at least to an engineer named MacIntyre who described (MacIntyre 1934) how he stabilised the humidity in the Orangery of Hampton Court Palace near London by stuffing the ventilation channels with discarded cotton fire hose.
Recent enquiries revealed no trace of the hose and no records of how well it worked. Whatever the actual performance, MacIntyre's initiative was not imitated. The modern museum is generally a lightly built structure with no natural climatic stability whatever.
MacIntyre's cotton hose required air circulation through the ducts. The walls of the gallery were of brick, plaster and wood panelling. None of these materials provide significant buffering.
In this paper I explore a bolder concept which is scarcely applicable to historic palaces but should work well in modern structures: walls and ceilings made of absorbent materials will buffer the climate much more effectively. For some purposes this buffering is so effective that mechanical systems are not necessary. In some places the average RH provided by passive buffers will be too high. In such circumstances a relatively small and simple air conditioning system can gently nudge the climate towards the long term target while short term buffering by the material moderates the peak strains on the indoor climate.
The performance of such a passive, or hybrid, system is dependent on the ventilation rate and is in practice only useful for air exchange rates of less than once per hour. A cinema or a disco must therefore use mechanical air conditioning. On the other hand the quiet, unfrequented halls of an archive or a museum store can be passively buffered even against the yearly cycle of relative humidity (Christoffersen 1995, Padfield and Jensen 1990).
There is no readily available design tool that the architect can use to explore the use of absorbent materials to moderate the indoor climate. All the available computer programs for calculating moisture movement within porous walls take the interior relative humidity as a boundary condition, defined by the person sitting at the keyboard. However, when the room has absorbent walls the RH is defined by the interaction of the walls with various sources, and sinks, of water vapour within the room. The RH is a consequence of the behaviour of the walls, not a controlling parameter.
The lack of suitable computer models is matched by a lack of experimental climate chambers that can imitate the situation in a room with buffering walls. Such a chamber should define a flux of moisture into, or out of, the chamber air and measure the resulting RH change, as buffered by the experimental wall within the chamber. This flux chamber is shown in the figure below and is described in detail elsewhere (Padfield 1998a).
The principle of operation of a climate chamber that defines a flux of water vapour into the interior space. The water vapour distributes itself between the air and the experimental wall, so that the RH is a consequence of the absorbtion characteristics of the wall.
In this article I first describe the material properties that are needed to calculate the buffering effect and then give some examples of measured and calculated buffering.
The sorption curve of the material defines how much water will be released or absorbed when the material moves from equilibrium with one RH value to another. The inverse argument is that this same curve also defines the RH change in air that results when the material loses a certain weight of water into a confined space. This is the basis for the buffer effect: when water is withdrawn from the air surrounding the material it will desorb water to compensate for the loss.
In a museum, where one presumably aims to keep a reasonably even and moderate RH, only that portion of the absorption curve between 40% and 65%RH is relevant. This part is fairly straight for most materials, so the absorption curve can be replaced by a constant: the water capacity.
The column below shows the water capacity per unit volume for several building materials. The capacity is defined as the weight of water that would be released from one cubic metre of material if the RH changed from 100% to zero, assuming a sorption curve gradient constant at the value for 50% RH. If this seems rather complicated just think of the indicated value as ten times the amount of water released when the RH falls from 55% to 45% RH.
The highest capacity material is clay, in a lightweight mixture described below. It has a value of about 60. Wood comes next at around 40 and then cellular concrete at just over 20 units. Wool insulation, though highly absorbent, has rather poor capacity, because of its low density. The worst materials for buffering RH are the coarsely porous minerals: lime mortar, gypsum plaster and brick. To this list of poor performers can be added the mineral insulators such as perlite, glass wool and rockwool.
All the common building materials except wood lie at the inferior end of the scale of buffer capacity. Wood is not, however, a good buffer material, for a reason explained in the next section.
The position of a material on the column above does not define the buffer performance of the material, because water must be able to penetrate to the surface from the depth of the wall within the natural cycle time of the room RH. This depends, partly, on the permeability of the material.
Water vapour permeability is measured by placing the material over a cup containing a saturated salt solution to maintain a constant RH.
 The surrounding air is held at a different, but also constant, RH. After a short time the material will attain a steady water content gradient through its thickness. After this startup period the weight of the cup of salt solution will change at a constant rate as water evaporates from the cup or condenses into it. This weight change can be converted into a permeability constant for the material. The values given in the figure below were obtained by maintaining 75% RH within the cup and 50% RH outside.
Notice that wood gives two very different values according to its orientation. The caption wood::: indicates permeability parallel to the cell direction. Wood cut across the grain in this way is very rarely encountered.
A higher permeability makes possible a better performance as a buffer but there is an important complication when the RH is changing: as the water vapour diffuses into the material according to the diffusion coefficient it is being grabbed by the pore walls, according to the absorption coefficient. A material with both a high permeability and a high absorption coefficient will actually show a low permeability to water vapour under dynamic circumstances, because the water is absorbed before it has diffused far.
Calculation of this complex process is aided by defining a unit called the diffusivity, which is the diffusion coefficient divided by the absorption coefficient. If the imposed cycle is approximately sinusoidal the diffusivity can be used to calculate an active depth for moisture exchange by using the expression:
![]()
where d is the active depth for water exchange, t is the period of the water flux cycle and D is the diffusivity. The active depth marks the distance into the wall at which the variation in RH in the pores has fallen to about one third of the variation in the room. The mathematical derivation of this expression for the analogous process of heat flow through a material is given by Claesson and Hagentoft (Claesson and Hagentoft 1994).
Unfortunately, the analogy between heat flow and moisture flow is not exact. The active depth described above assumes that equilibrium between the water vapour and the pore wall is instantaneous. There is good evidence that wood does not instantly react with water even on a microscopic scale (Wadsö 1993) and a similar argument may apply to other materials.
The effective depth given in the column above is therefore just an indication of the order of magnitude of the useful thickness of the material for buffering a daily (reading the left side of the column) and a yearly cycle in relative humidity.
The amount of water available is now given by multiplying the water capacity by this active depth. The result is shown in the column on the left. The most striking revelation in this column is that the good materials are not those used in building. Wood cut across the grain is by far the best buffer but is not ideal for museum use because it outgasses various corrosive vapours, notably acetic acid. Clay is the second best buffer. Most clays contain particles of iron sulfide, which can give off hydrogen sulfide in some circumstances but indoors one would expect oxidition to sulphate. Clay walls smell much less than wood, so maybe the danger is not so great. Notice that the active depth of clay is only about 5 mm for the daily cycle.
The diagram below redraws these columns with arrows showing the way the data are combined to give an estimation of the active depth.
Not so long ago, clay plaster was a common interior finish on walls of brick or earth in ordinary houses in many parts of the world. I have developed a clay buffer specially designed to give a large buffer capacity, which can be applied to existing walls as a veneer, or used to make a massive wall. A three centimetre thick surface coating of clay is more than enough for daily buffering. A 30 cm massive wall provides buffering of the annual cycle, if the air exchange is slow enough.
The clay which buffers best is sodium bentonite, which is a very fine grained montmorillonite. This is a marine deposit formed by the weathering of volcanic ash. It is used to make impermeable floors to toxic waste dumps so for our purpose the structure needs to be opened up to diffusion before bentonite is any use as a buffer. I used perlite as the filler. This is an expanded volcanic glass consisting of frothy glassy spheres of up to 2 mm diameter. These particles have a high thermal insulation but no absorptive power. Perlite does, however, provide good cohesion to the mixture because the delicate particles are damaged during the mixing. The resulting sharp edges and fragments provide a good bond to each other and to the clay, so that when the mixture dries from its initial plastic state the shrinkage is moderate (8 percent), the mechanical strength is good (about 2MPa compression strength) and the clay is present in an open structure of shell-like aggregates of the sub-microscopic clay plates. The structure is shown below.
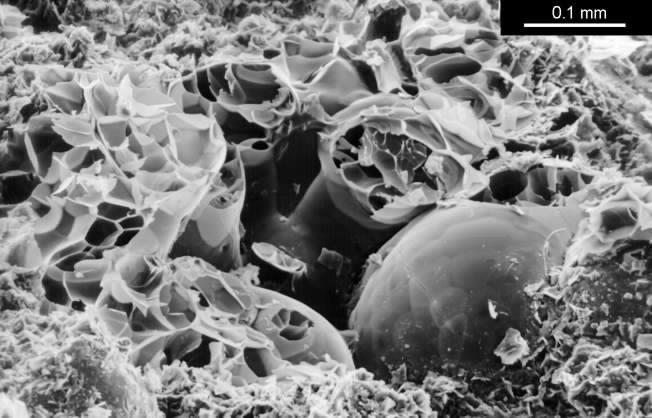
SEM image of a broken surface of the lightweight clay mixed from bentonite and perlite. One intact rounded perlite grain is visible. The smashed grains show the foamy internal structure. The bentonite is the fine grained mass of curved flakes at the bottom of the picture.
These two materials were mixed together in a baker's dough mixer in the ratio of about one part bentonite to ten parts perlite by volume. Some chopped straw was added at the last moment.
This mix can be cast into tiles for applying as a 4 cm thick buffer layer on existing walls. Laid the other way the tiles can be built up into a massive load bearing wall, using moist plastic clay as a mortar.
A clay wall was built within a climate chamber so that the ratio of wall area to chamber volume was about 0.7 to 1, which is typical of the ratio of wall and ceiling area to room volume in a building. The performance was also calculated by a simulation program which used the absorption and permeability described above to calculate the distribution of water between the wall and the room air. The details of these investigations are described elsewhere (Padfield 1998b).
The central panel shows a four day cycle in the experimental chamber with a clay wall under test. The purple line is the calculated RH in the empty chamber. The shallower curves show the RH measured in the chamber and within the clay wall at 9 mm from the surface and at the sealed back of the tile at 34 mm. The graph on the left is the same cycle modelled using the measured sorption and permeability coefficients. The graph on the right is made from the model with the coefficients adjusted to give the best fit to the experimental data.
(The diffusion coefficients have exponent -12, the water capacity is in units of kg/cu.m./100%RH, as in the diagrams shown earlier)
The 'room' imitated by the climate chamber was first subjected to a sinusoidal water vapour flux which would, without buffering, cause the RH to oscillate between 20% and 100% RH in a daily cycle. The maximum rate of drying corresponds with a leak rate of about 0.5 air changes per hour to outside air in winter. The daily cycle hardly reached the depths of the tile so a four day cycle, with the same maximum flux rate, was imposed. The result is shown in the middle graph. The large amplitude curve (the purple line) is the expected RH variation in the empty chamber. The flux was sufficient to cause condensation for many hours in the empty chamber, whose RH reaches 100% early in the cycle. The orange line shows the actual relative humidity in the chamber, very much flattened out in comparison to the purple curve for the empty chamber. Lighter lines show the RH in small holes at two depths within the wall.
The theoretical performance of the clay wall is shown in the graph to the left. It is not so good as the measured performance. The values for absorption and diffusion coefficients were then adjusted to give the best fit to the measurements (the graph on the right). This is obtained by using an absorption coefficient which is slightly higher than measured and with a diffusion coefficient three times higher than the measured value. The discrepancy is considerable and not yet explained.
The long term effect of ventilation, of winter air into a building for example, is shown in the model below. Air of constant 20%RH is leaked into a room first equilibrated to 58%RH. The subsequent decline of RH towards 20% is shown in the graph in a series of curves for different leakage rates. The best fit constants from the cyclic experiments were used in the theoretical model to predict the drying over two months.
Figure 5. The rate of decline of the RH in a room initially at 58%RH leaking in air at 20% RH. The model uses the adjusted coefficients from the right hand graph in the previous figure.
(Right-click on image and select 'view image' for higher resolution)
The buffering against one air change per hour is not impressive: the RH has dropped almost half way to the final value within a day. The half time to equilibrium for a room with a quarter of an air change per hour, which is quite attainable in a modern house, is stretched out to two weeks. The annual cycle calculated for one air change per day is shown in the next figure.
The predicted annual RH cycle in a clay walled building with 0.05 air changes per hour. The flatter curves are the RH at various depths within the wall, which is sealed on the outside.
(Right-click on image and select 'view image' for higher resolution)
This slow air change is attainable without particular difficulty in archives and storage vaults where people only enter occasionally. If there is sufficient absorptive material within the building there is no need for absorbent walls, as shown by Christoffersen's analysis of an archive (Christoffersen 1995) and by Padfield and Jensen's modelling of a museum store containing wood (Padfield and Jensen 1990).
There are still some practical details that need to be considered. The surface finish should not dust away and should not be prone to rapid discoloration by accumulated dust. The buffer performance of the clay wall, which is used as an example rather than as a recommendation of the best material, is only slightly reduced by a thin layer of lime or gypsum plaster. Absorbent surfaces above about shoulder level are quite practical, if the dust control is otherwise appropriate for a museum!
Absorbent walls and ceilings will significantly improve the climatic stability of indoor spaces that are ventilated at one air change per hour or less. This ventilation rate is inadequate for popular museums and galleries but is reasonable in less visited museums and in study collections and reading rooms. The message is clear: here is an untapped resource for museum climate control.
The work described here was done at the Department of Structural Engineering and Materials, The Technical University of Denmark. It was supported by grants from the Danish Department of Energy, the Ministry of Culture, The National Museum and the Technical University.
Christoffersen, Lars B. 1995, 'Zephyr, Passive Climate Controlled Repositories', Lund University, Department of Building Physics, Report nr: TVBH-3028, 1995. ISBN 91-88722-06 6.
Claesson, Johan and Hagentoft, Carl-Eric. 1994, 'Basic building physics - mathematical modelling, University of Lund, Department of Building Science.
MacIntyre, J. 1934, 'Air conditioning for Mantegna's cartoons at Hampton Court Palace', Technical Studies in the Field of the Fine Arts, 2 nr 4 April 1934, pp 171-184.
Padfield, T., Jensen, P. 1990, 'Low energy climate control in museum stores', International Council of Museums, Committee for Conservation, 9th triennial meeting, Dresden, pp 596-601.
Padfield, T. 1998, 'A climate chamber that controls water vapour flux', Third International Symposium on Humidity and Moisture, National Physical Laboratory (UK), vol.2 pp 57-63. 1998 ISBN 0 946754 24 1, CD: ISBN 0 946754 25 X.
Padfield, T. 1998, 'The role of porous building materials in moderating changes of relative humidity', Ph.D. thesis, Department of Structural Engineering and Materials, The Technical University of Denmark. Also available (from the author) on CD, with working programs.
Wadsö, Lars, 1993, 'Studies of water vapour transport and sorption in wood', Doctoral Dissertation, Report TVBM-1013, Department of Building Materials, Lund University, Sweden, pp 57 - 72. See also: Arfvidsson, Jesper, 'Moisture transport in porous media', Lund University, Department of Building Science, Report TVBH-1010 (1998).

This work is licensed under a Creative Commons Attribution-Noncommercial-No Derivative Works 3.0 License.